Fig. 1
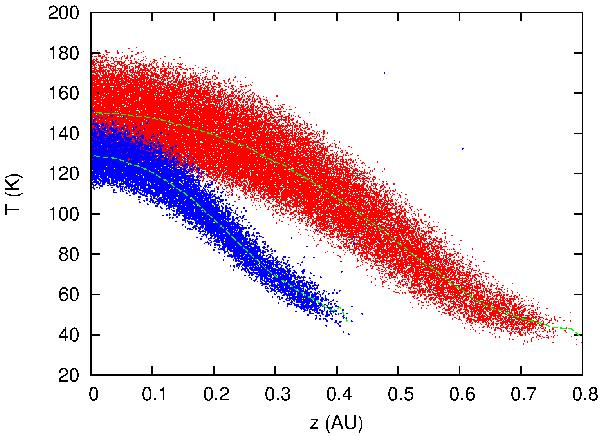
Temperature profiles as a function of the height over the median plane of the disk (z component) for the primary disk at r ~ 6 AU and for the secondary disk at r ~ 3 AU. These locations are far from the center of the disk where the heating due to the spiral waves, even at apocenter, is the strongest. The dots are the individual temperatures of the SPH particles encompassed between 6 and 6.3 AU for the primary disk and 3 and 3.3 AU for the secondary disk. The continuous lines are the average temperature values. The SPH particles of the primary disk are represented by red dots, while blue dots are relative to the secondary disk.
Current usage metrics show cumulative count of Article Views (full-text article views including HTML views, PDF and ePub downloads, according to the available data) and Abstracts Views on Vision4Press platform.
Data correspond to usage on the plateform after 2015. The current usage metrics is available 48-96 hours after online publication and is updated daily on week days.
Initial download of the metrics may take a while.