Fig. 4
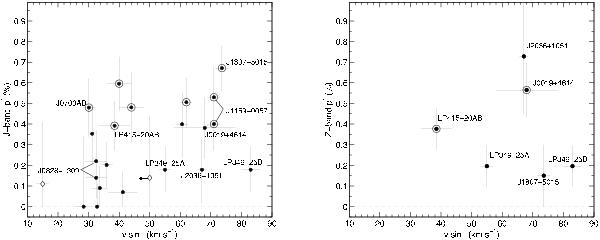
Debiased J- (left) and Z-band (right) linear polarization degree as a function of projected rotational velocity. Our data are plotted as black dots and data from the literature (see text) as open diamonds (the arrow stands for an upper limit on v sin i). Positive detection of linear polarization (P/σ ≥ 3) is indicated by open circles surrounding the black dots. Some objects are labeled. For LP 415−20AB we plotted the average v sin i since both components share similar values; for the LP 349−25 binary system both components are plotted separately given their differing spectroscopic rotational velocities. Velocity measurements and their associated error bars are taken from the literature as explained in the text and Table 1.
Current usage metrics show cumulative count of Article Views (full-text article views including HTML views, PDF and ePub downloads, according to the available data) and Abstracts Views on Vision4Press platform.
Data correspond to usage on the plateform after 2015. The current usage metrics is available 48-96 hours after online publication and is updated daily on week days.
Initial download of the metrics may take a while.