Fig. 8
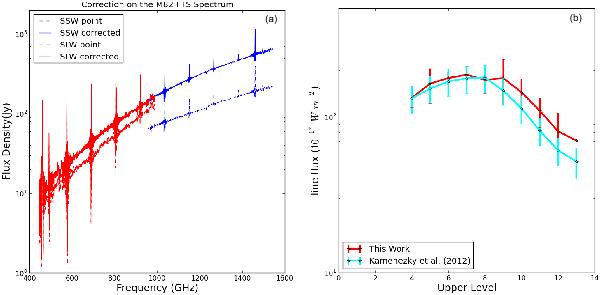
M82 FTS spectrum corrected with the method developed in this work. a) Spectrum of M82 observed by the FTS on 2010−11−08 (OD 543). Red and blue indicate the spectra observed by the SLWC3 and SSWD4, respectively. The dashed line shows the spectrum calibrated by the point-source calibration mode. The solid line shows the spectrum corrected by the method presented in this work with a best-fit source re = 11′′ (see Eq. (18).) b) Comparison of the CO SLEDs from the starburst core of M82. Red indicates the fluxes derived from the central detector spectrum (SLWC3 and SSWD4), corrected for the source distribution and convolved to a Gaussian beam of FWHM = 42′′ (red). Cyan is the same spectrum corrected by a source-beam coupling factor derived from the SPIRE photometry 250 μm map with appropriate profiles to produce the continuum light distribution seen with the FTS (cyan, Kamenetzky et al. 2012).
Current usage metrics show cumulative count of Article Views (full-text article views including HTML views, PDF and ePub downloads, according to the available data) and Abstracts Views on Vision4Press platform.
Data correspond to usage on the plateform after 2015. The current usage metrics is available 48-96 hours after online publication and is updated daily on week days.
Initial download of the metrics may take a while.