Fig. 7
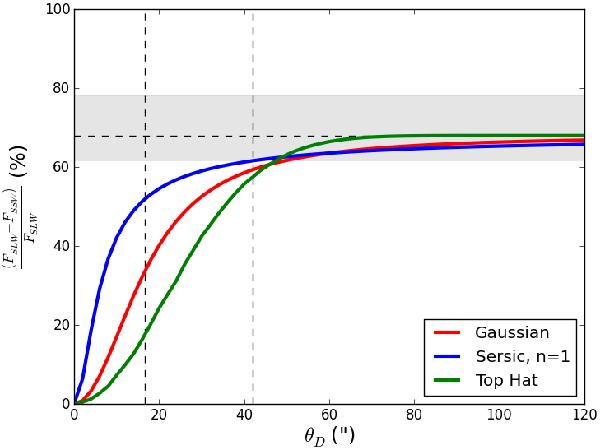
Demonstration of how the angular size of source affects the flux difference at the overlap bandwidth for a top-hat (green), a Gaussian (red), and, a Sersic n = 1 (blue) profile. The two vertical dashed lines indicate the largest and the smallest beam FWHM of the FTS at 42′′ and 16.55′′. The horizontal dashed line indicates the percentage difference of the fluxes if a source uniformly fills the beams without taking ηc in account, while the gray band indicates the same value but accounts for the uncertainty introduced by ηc.
Current usage metrics show cumulative count of Article Views (full-text article views including HTML views, PDF and ePub downloads, according to the available data) and Abstracts Views on Vision4Press platform.
Data correspond to usage on the plateform after 2015. The current usage metrics is available 48-96 hours after online publication and is updated daily on week days.
Initial download of the metrics may take a while.