Fig. 1
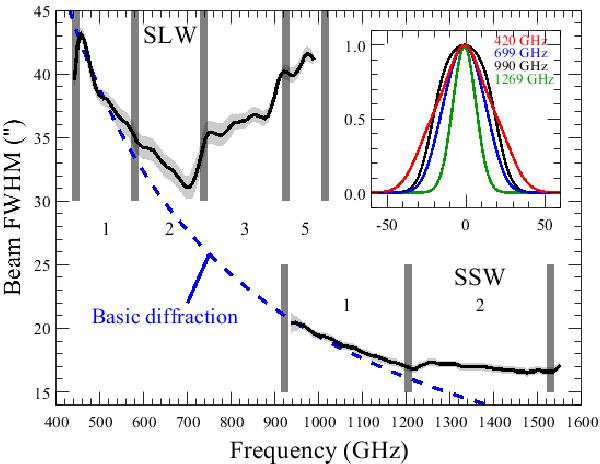
SPIRE FTS spectral beam size as measured by Makiwa et al. (2013). The shaded region shows 3σ errors. The frequencies at which the waveguide modes are enabled and the number of modes expected to be present (from theory) in each range is also shown, along with the expected size due to single–mode diffraction (dashed blue line). The inset plot shows the shape of the profile at 3 sample frequencies from SLW (420, 699, 990 GHz) and one frequency from SSW (1269 GHz). The horizontal axis of the inset plot is in the unit of arcsec.
Current usage metrics show cumulative count of Article Views (full-text article views including HTML views, PDF and ePub downloads, according to the available data) and Abstracts Views on Vision4Press platform.
Data correspond to usage on the plateform after 2015. The current usage metrics is available 48-96 hours after online publication and is updated daily on week days.
Initial download of the metrics may take a while.