Free Access
Fig. 6
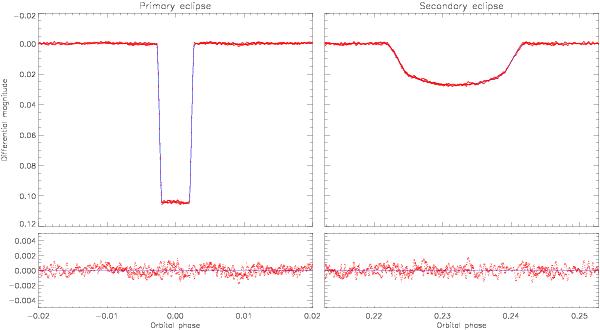
Primary (left panels) and secondary eclipse (right panels) of KIC 8410637. The Kepler data points are shown as red dots and the JKTEBOP best fit as the blue curve. The residuals of the fit are shown in the lower panels with an expanded scale on the ordinate axis.
Current usage metrics show cumulative count of Article Views (full-text article views including HTML views, PDF and ePub downloads, according to the available data) and Abstracts Views on Vision4Press platform.
Data correspond to usage on the plateform after 2015. The current usage metrics is available 48-96 hours after online publication and is updated daily on week days.
Initial download of the metrics may take a while.