Free Access
Fig. 3
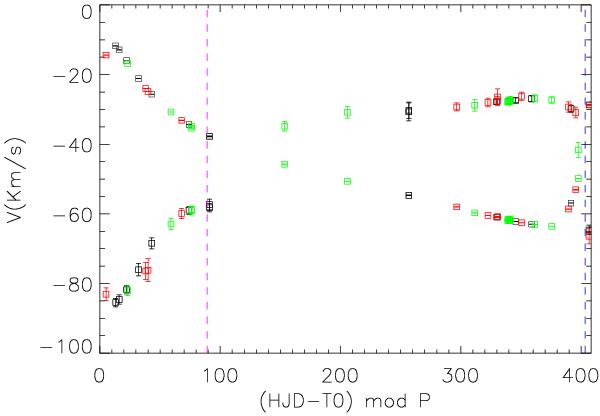
Radial velocities derived with the LBF method. Error bars are indicated, but are much smaller than the point sizes for the RG. Black are observations with the NOT, red from the TLS and green from the mercator telescope. The vertical dashed lines indicate the mid-time of the eclipses.
Current usage metrics show cumulative count of Article Views (full-text article views including HTML views, PDF and ePub downloads, according to the available data) and Abstracts Views on Vision4Press platform.
Data correspond to usage on the plateform after 2015. The current usage metrics is available 48-96 hours after online publication and is updated daily on week days.
Initial download of the metrics may take a while.