Fig. 2
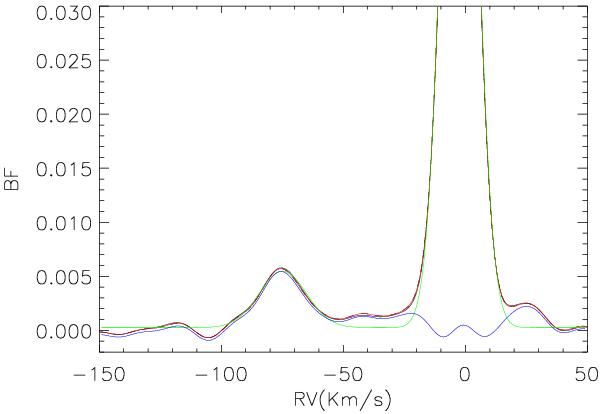
The line broadening function for an epoch with large RV separation. The red curve is the LBF derived from the data. The green curve is a fit of two Gaussians. The large out-of-range peak comes from the RG and the small peak from the MS star. The blue curve is what remains after subtracting a Gaussian function for the RG star.
Current usage metrics show cumulative count of Article Views (full-text article views including HTML views, PDF and ePub downloads, according to the available data) and Abstracts Views on Vision4Press platform.
Data correspond to usage on the plateform after 2015. The current usage metrics is available 48-96 hours after online publication and is updated daily on week days.
Initial download of the metrics may take a while.