Fig. 7
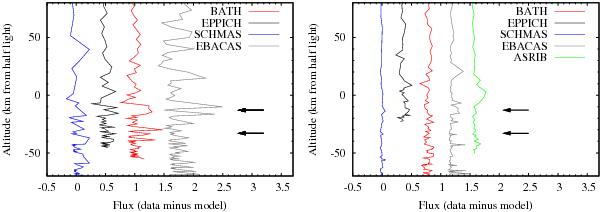
Profile of stellar flux with model lightcurve subtracted against altitude relative to the instant of half-light in every case. The arrows indicate the position of prominent features (“spikes”) observed in the ingress profiles (left) and their expected locations in the egress ones (right). Profiles at ingress (egress) are horizontally separated by 0.5 (0.4) units for clarity.
Current usage metrics show cumulative count of Article Views (full-text article views including HTML views, PDF and ePub downloads, according to the available data) and Abstracts Views on Vision4Press platform.
Data correspond to usage on the plateform after 2015. The current usage metrics is available 48-96 hours after online publication and is updated daily on week days.
Initial download of the metrics may take a while.