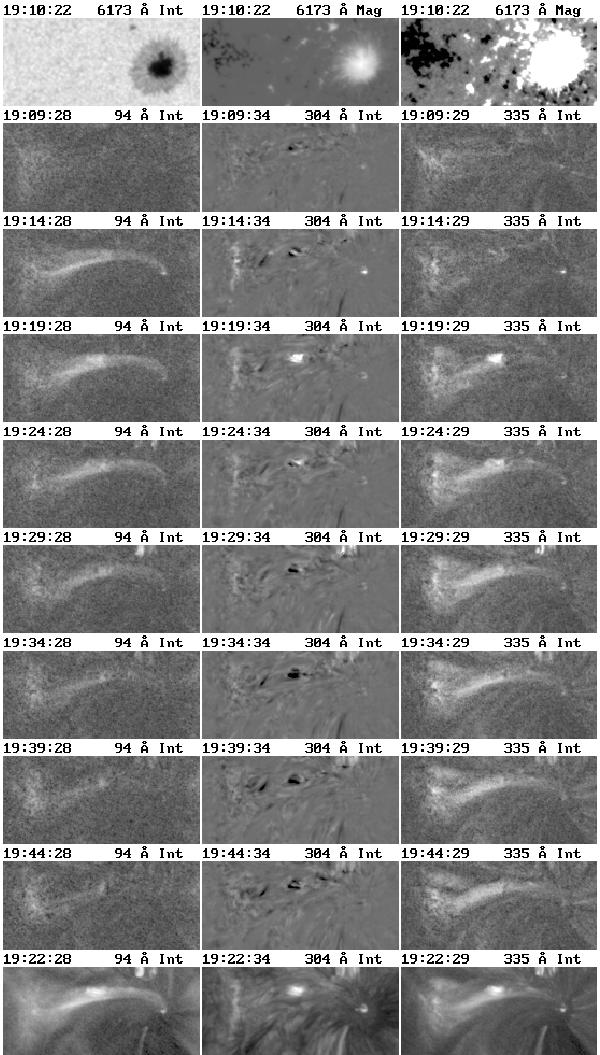
Fig. 3

Time sequence of difference images in the AIA 94, 304, and 335 Å bands over a field of view of 100′′ by 45′′. The last row shows images of the intensity rms during the sequence (19:00 to 19:45 UT), while the first row shows HMI images of continuum intensity and longitudinal magnetic field, saturated at ± 100 G in the right column. The 335 and 94 Å images are one minute averages to reduce noise. The small bright structure near the middle of the loop is an unrelated phenomenon. The images have been rotated by 39° with respect to the solar E-W direction.
Current usage metrics show cumulative count of Article Views (full-text article views including HTML views, PDF and ePub downloads, according to the available data) and Abstracts Views on Vision4Press platform.
Data correspond to usage on the plateform after 2015. The current usage metrics is available 48-96 hours after online publication and is updated daily on week days.
Initial download of the metrics may take a while.


