Free Access
Fig. 7
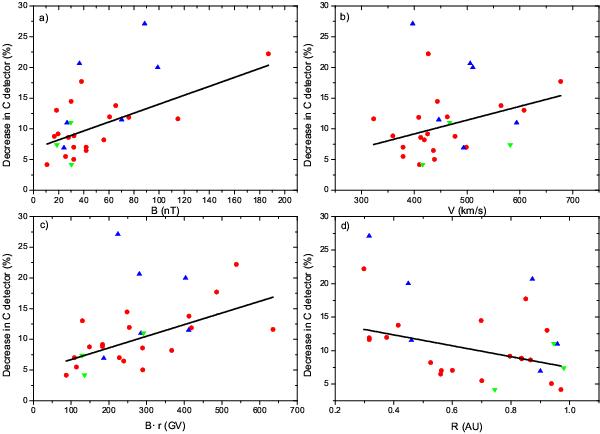
Decrease in C detector versus MC magnetic field intensity (a), MC speed (b), MC associated rigidity (c) and distance to Sun (d). Red circles, blue up triangles and green down triangles represent Type 1, 1*, and 2, respectively. The solid black lines represent the linear fit to type 1.
Current usage metrics show cumulative count of Article Views (full-text article views including HTML views, PDF and ePub downloads, according to the available data) and Abstracts Views on Vision4Press platform.
Data correspond to usage on the plateform after 2015. The current usage metrics is available 48-96 hours after online publication and is updated daily on week days.
Initial download of the metrics may take a while.