Fig. 5
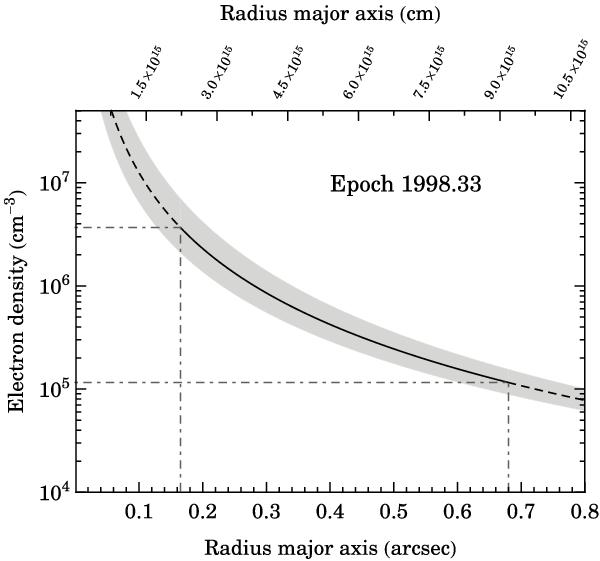
Dependence of the electron density on the radius for the compact HII region of CRL 618. The solid line indicates the region for which we have measurements of the size of the major axis as a function of frequency (see Fig. 4). The dashed lines are extrapolations of the fit following the same power-law dependance. The gray region represents the uncertainty region due to the error of the fitted parameters. The horizontal/vertical dot-dashed lines indicate the extreme values of the electron density and size of the source, corresponding to the observing frequencies: ν = 43.31 and 1.46 GHz (see Table 6).
Current usage metrics show cumulative count of Article Views (full-text article views including HTML views, PDF and ePub downloads, according to the available data) and Abstracts Views on Vision4Press platform.
Data correspond to usage on the plateform after 2015. The current usage metrics is available 48-96 hours after online publication and is updated daily on week days.
Initial download of the metrics may take a while.