Fig. 6
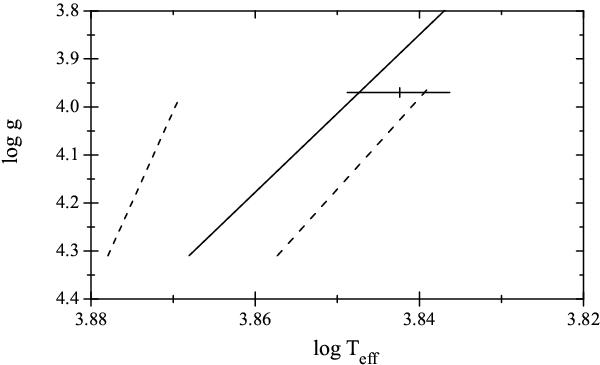
Location of the primary of KIC 11285625 in the log (Teff) – log g diagram. The γ Dor and the red edge of the δ Sct observational instability strips are represented by the dashed and solid lines, correspondingly. According to the photometric Teff and log g, the secondary component would be located in the lower right corner of the diagram, outside both instability strips.
Current usage metrics show cumulative count of Article Views (full-text article views including HTML views, PDF and ePub downloads, according to the available data) and Abstracts Views on Vision4Press platform.
Data correspond to usage on the plateform after 2015. The current usage metrics is available 48-96 hours after online publication and is updated daily on week days.
Initial download of the metrics may take a while.