Fig. 2
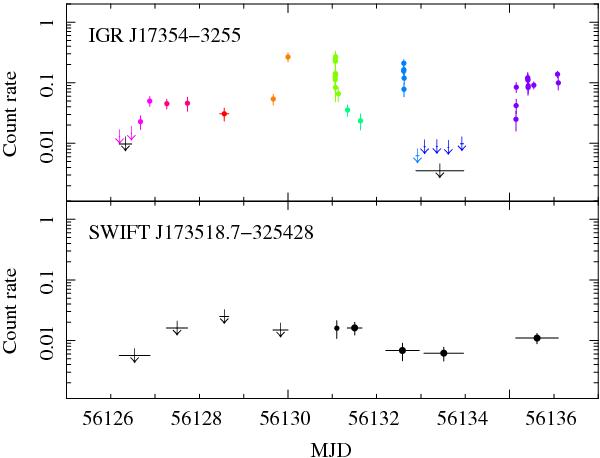
Swift/XRT 0.3–10 keV light curves of the two X-ray sources detected within the region around IGR J17354–3255, during the 2012 July monitoring program. Downward-pointing arrows are 3σ upper limits. Top: Swift J173527.7–325555 (src1, identified with the soft X-ray counterpart of IGR J17354–3255). Different colors mark different days (see Table 1). Bottom: Swift J173518.7–325428 (src2).
Current usage metrics show cumulative count of Article Views (full-text article views including HTML views, PDF and ePub downloads, according to the available data) and Abstracts Views on Vision4Press platform.
Data correspond to usage on the plateform after 2015. The current usage metrics is available 48-96 hours after online publication and is updated daily on week days.
Initial download of the metrics may take a while.