Fig. 1
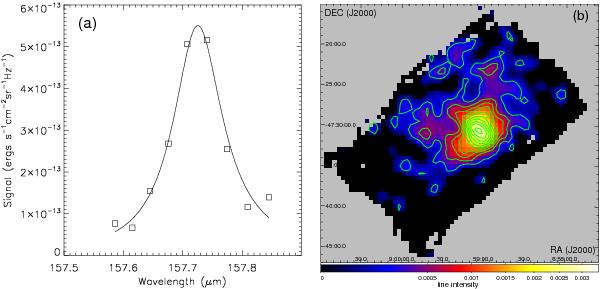
a) [CII] line profile in a single spectral scan obtained during the observation of RCW 38 with the balloon-borne FPS100. b) [CII] line map of an area of about 30′ × 15′ around RCW38. The color levels are given in units of erg s-1 cm-2 sr-1. The contours are drawn with linearly spaced 10 levels from 2.1 × 10⁻⁴ to 3.4 × 10⁻³ erg s-1 cm-2 sr-1.
Current usage metrics show cumulative count of Article Views (full-text article views including HTML views, PDF and ePub downloads, according to the available data) and Abstracts Views on Vision4Press platform.
Data correspond to usage on the plateform after 2015. The current usage metrics is available 48-96 hours after online publication and is updated daily on week days.
Initial download of the metrics may take a while.