| Issue |
A&A
Volume 556, August 2013
|
|
|---|---|---|
| Article Number | A24 | |
| Number of page(s) | 9 | |
| Section | Atomic, molecular, and nuclear data | |
| DOI | https://doi.org/10.1051/0004-6361/201321594 | |
| Published online | 19 July 2013 | |
Electron impact excitation of Mg VIII
Collision strengths, transition probabilities and theoretical EUV and soft X-ray line intensities for Mg VIII⋆
1
Centre for Theoretical Atomic, Molecular and Optical Physics, School of
Mathematics and Physics, Queen’s University Belfast,
Belfast,
BT7 1NN,
UK
e-mail:
This email address is being protected from spambots. You need JavaScript enabled to view it.
2
Astrophysics Research Centre, School of Mathematics and Physics,
Queen’s University Belfast, Belfast, BT7
1NN, UK
Received: 28 March 2013
Accepted: 14 June 2013
Abstract
Context. Mg viii emission lines are observed in a range of astronomical objects such as the Sun, other cool stars and in the coronal line region of Seyfert galaxies. Under coronal conditions Mg viii emits strongly in the extreme ultraviolet (EUV) and soft X-ray spectral regions which makes it an ideal ion for plasma diagnostics.
Aims. Two theoretical atomic models, consisting of 125 fine structure levels, are developed for the Mg viii ion. The 125 levels arise from the 2s22p, 2s2p2, 2p3, 2s23s, 2s23p, 2s23d, 2s2p3s, 2s2p3p, 2s2p3d, 2p23s, 2p23p and 2p23d configurations. Electron impact excitation collision strengths and radiative transition probabilities are calculated for both Mg viii models, compared with existing data, and the best model selected to generate a set of theoretical emission line intensities. The EUV lines, covering 312–790 Å, are compared with existing solar spectra (SERTS–89 and SUMER), while the soft X-ray transitions (69–97 Å) are examined for potential density diagnostic line ratios and also compared with the limited available solar and stellar observational data.
Methods. The R-matrix codes Breit-Pauli RMATRXI and RMATRXII are utilised, along with the PSTGF code, to calculate the collision strengths for two Mg viii models. Collision strengths are averaged over a Maxwellian distribution to produce the corresponding effective collision strengths for use in astrophysical applications. Transition probabilities are also calculated using the CIV3 atomic structure code. The best data are then incorporated into the modelling code CLOUDY and line intensities generated for a range of electron temperatures and densities appropriate to solar and stellar coronal plasmas.
Results. The present effective collision strengths are compared with two previous calculations. Good levels of agreement are found with the most recent, but there are large differences with the other for forbidden transitions. The resulting line intensities compare favourably with the observed values from the SERTS-89 and SUMER spectra. Theoretical soft X-ray emission lines are presented and several density diagnostic line ratios examined, which are in reasonable agreement with the limited observational data available.
Key words: atomic data / atomic processes / plasmas / scattering / Sun: UV radiation / Sun: X-rays, gamma rays
The effective collision strength data are only available at the CDS via anonymous ftp to cdsarc.u-strasbg.fr (130.79.128.5) or via http://cdsarc.u-strasbg.fr/viz-bin/qcat?J/A+A/556/A24
© ESO, 2013
1. Introduction
Emission lines of Mg viii are observed from a wide variety of astronomical objects ranging from the Sun to active galactic nuclei (AGN). For example, the Solar Ultraviolet Measurements of Emitted Radiation (SUMER) spectrograph on board Solar and Heliospheric Observatory (SOHO) detected emission lines of Mg viii lying within the extreme-ultraviolet (EUV) spectral region (Curdt et al. 2001), while the 1989 and 1997 Solar EUV Rocket Telescope and Spectrograph (SERTS) active region spectra contain several Mg viii features in the 300–450 Å region (Thomas & Neupert 1994; Brosius et al. 2000). Measurements of solar Mg viii lines have also been obtained with the S-055 and S082A instruments on Skylab (Vernazza & Reeves 1978; Foster et al. 1997a). As well as being an important solar density diagnostic ion it can also be employed as a temperature indicator when combined with another ionisation stage of Mg. For example, Mg viii 315 Å/Mg × 624 Å forms a useful temperature sensitive line ratio (Landi et al. 2002). The Mg viii 3.02 μm feature arising from the transition within the ground state (2s22p 2P1/2–2s22p 2P3/2) has been observed in the spectrum of the high excitation planetary nebula NGC 6302 (Reconditi & Oliva 1993), and in the coronal line region of AGN (Prieto & Viegas 2000).
Previously, Zhang et al. (1994) performed an R-matrix calculation for Mg viii which encompassed the lowest 15 fine-structure levels arising from the 2s22p, 2s2p2 and 2p3 configurations. Transitions amongst the n = 2 complex give rise to the lines of Mg viii observed in the EUV region. However, Dwivedi (1990) has highlighted the potential of soft X-ray emission lines such as 75.03 and 74.86 Å as density diagnostics, which have been detected in solar spectra (Malinovsky & Heroux 1973; Acton et al. 1985). Soft X-ray lines of Mg viii have also been observed by the Chandra satellite in absorption in the spectrum of the white dwarf H 1504+65 and in emission in Procyon plus α Cen A and B (Werner & Drake 2005). However, these lines arise from transitions between the n = 2 and 3 levels which were not included in the calculation of Zhang et al. (1994). A subsequent distorted-wave calculation by Bhatia & Thomas (1998) incorporated the 20 fine-structure levels arising from the 2s22p, 2s2p2, 2p3, 2s23s, 2s23p and 2s23d configurations. These authors noted some discrepancies between their theoretical intensities and the SERTS-89 measurements for the lines at 430.44 and 436.73 Å, which they suggested may have been due to the lack of resonances in the calculation. However, in a subsequent analysis of the SERTS–89 active region spectrum by Young et al. (1998), concerns were raised regarding the calibration of the 430–450 Å region. Also, Brosius et al. (2000) studied the line intensities from the SERTS–97 spectrum for a range of ions, and in most cases good agreement was found between theoretical and observed values. However, the authors noted that improvements may be required in the theory for Mg viii, which showed some slight discrepancies.
As soft X-ray emission lines have been observed from levels lying above those considered by Bhatia & Thomas (1998), it is essential to incorporate additional levels in the current calculation. In the present work the number of fine-structure levels has been extended to 125 to include all of the n = 3 levels. Collision strengths and transition probabilities have been calculated for Mg viii using the R-matrix and CIV3 (Hibbert 1975) codes, respectively.
Following the completion of our calculations, the recent work of Liang et al. (2012) was kindly brought to our attention by the referee. Liang et al. (2012) performed a series of intermediate-coupling frame transformation (ICFT) R-matrix calculations for the B-like iso-electronic sequence, including Mg viii. The calculation incorporated the additional n = 3 and n = 4 complexes, giving rise to a total of 204 fine structure levels.
In the present calculation, two different models were developed for the collision strength calculation, both including all 125 fine-structure levels arising from the 2s22p, 2s2p2, 2p3, 2s23s, 2s23p, 2s23d, 2s2p3s, 2s2p3p, 2s2p3d, 2p23s, 2p23p and 2p23d configurations. The two different models were designed to enable an examination of the effects of including varying amounts of CI in the target wavefunctions and to permit a comparison between the Breit-Pauli and RMATRXII codes. The two models are described in detail in Sect. 2, where the energy levels and transition probabilities are presented. Section 2 also contains a detailed description of the collision calculation. In Sect. 3 a selection of collision strengths and effective collision strengths are presented for both models and compared with the results of Zhang et al. (1994) and Liang et al. (2012). Theoretical line intensities are calculated using CLOUDY C13 (Ferland et al. 2013) in Sect. 4 and compared with existing observational data. Also, several diagnostic line ratios are presented which involve soft X-ray features. Section 5 is dedicated to several concluding remarks.
2. Atomic model
2.1. Target model
Two different models were developed to represent the Mg viii target ion, consisting of a total of 58 LS target levels which were formed from the 2s22p, 2s2p2, 2p3, 2s23s, 2s23p, 2s23d, 2s2p3s, 2s2p3p, 2s2p3d, 2p23s, 2p23p and 2p23d configurations. The appropriate wavefunctions for these target states were developed using the CIV3 code (Hibbert 1975). CIV3 uses the configuration interaction method and expresses each orbital in terms of an analytical basis set. The spin and spatial contributions are distinct with the radial part, Pnl, of each one-electron orbital taken to be a linear combination of Slater-type orbitals  (1)The first model, henceforth referred to as M1, consisted of a set of 6 spectroscopic orbitals; 1s, 2s, 2p, 3s, 3p and 3d. In the second model, M2, the same set of 6 spectroscopic orbitals was employed as well as an additional set of 3 pseudo orbitals;
  ,
,  and
and  . Orbital parameters (ci, pi, ξi) for the 1s, 2s and 2p orbitals were taken from the extensive tables of Clementi & Roetti (1974), and those for the remaining 6 orbitals were generated with CIV3 and can be found in Table 1. The configuration interaction expansions for the M1 wavefunctions consist of all possible configurations which can be formed from the 1s, 2s, 2p, 3s, 3p and 3d orbitals with a closed 1s2 shell. Similarly, the M2 wavefunctions are formed from all possible configurations resulting from the complete set of 9 basis orbitals with a closed 1s2 shell. The two models were developed to investigate whether the additional configuration interaction terms influenced the resulting collision strengths in any way.
Orbital parameters (ci, pi, ξi) obtained using CIV3 for the 3s, 3p, 3d,  ,
,  and
and  orbitals.
Transition probabilities (in s-1) for E1 transitions in Mg viii from Model 1 and Model 2 calculations.
Energy levels produced by the two models are presented in Table 6, along with those of Zhang et al. (1994) and experimental energies of Martin & Zalubas (1980). From Table 6 it can be seen that all but 5 of the M1 energies are within 1% of the experimental values. The 2s2p24P level shows the poorest agreement, being 5.4% smaller than the experimental value. Overall, the M2 calculation provided an improvement on the results of M1. Only one of the M2 energy levels differs from the experimental value by greater than 1%. This, once again, is for 2s2p24P, where the energy level is now 3% smaller than the experimental value. The energies from M2 are comparable to those of Zhang et al. (1994). However, M2 is a far more extensive calculation which will allow an analysis of soft X-ray emission lines.
A comparison with the energy levels of Liang et al. (2012) is not possible since theoretical energies were only published for four ions (Ne5+, Ar13+, Fe21+ and Kr31+) along the B-like iso-electronic sequence.
2.2. Transition probabilities
To examine the accuracy of the two models further, transition probabilities were also calculated using CIV3 for the E1, E2, M1 and M2 transitions. Rynkun et al. (2012) performed one of the most extensive oscillator strength calculations for the Boron-like iso-electronic sequence using the MCDHF method. In Table 2 the present results are compared with those of Rynkun et al. (2012) and Bhatia & Thomas (1998) for the first few E1 transitions to further assess the credibility of both models. It can be seen from the table that there is extremely good agreement between Model 2 and Rynkun et al. (2012), with discrepancies of less than 5%. The Model 1 calculation also exhibits good agreement with Rynkun et al. (2012), since the differences are less than 15%. Finally, we note that the results of Bhatia & Thomas are within 20% of those of Rynkun et al. (2012).
2.3. Collision calculation
The electron impact excitation collision strengths for both models were calculated using the R-matrix codes. In both calculations, the R-matrix boundary radius was taken to be 5 au and the number of continuum orbitals per value of total angular momentum was set at 15. For M1 the internal region information was calculated in intermediate jK coupling by employing the RMATRXI Breit-Pauli suite of codes. Where available, the theoretical energies were shifted to the appropriate experimental values. Calculations were performed for all partial waves with 2J ≤ 36. The code PSTGF (Balance & Griffin 2004) was utilised to perform the external region calculations and to determine the final set of collision strengths. When running PSTGF the Coulomb-Bethe approximation was also included, which takes into account the contribution of partial waves with 2J > 36.
M2 was developed to examine if having a larger CI expansion, and thus slightly better energies, provided a substantial improvement over M1. Internal region information for M2 was obtained in LS coupling, through use of the RMATRXII (Burke et al. 1994) suite of codes (ANG, RAD and HAM). The code FINE (Burke, priv. comm.) was then adopted to transform the internal region information from LS to intermediate coupling. To take account of term splitting in the target, FINE transforms the R-matrix in pair coupling by employing term coupling coefficients (TCCs). The TCCs are the mixing coefficients for the individual LiSiπi states and govern the formation of the appropriate Jiπi states. Results were obtained for all partial waves with 2J ≤ 16. The external region code PSTGF was once again employed to obtain the final set of collision strengths.
In both calculations the same fine mesh of energy points was adopted throughout the resonance region up to 16.9 Ryd. A constant mesh spacing of 2 × 10⁻⁴ Ryd was utilised in the resonance region, similar to the 2.45 × 10⁻⁴ Ryd mesh employed by Liang et al. (2012). A total of 250 points were used in the coarse mesh region from 16.9–50 Ryd.
The collision strength, Ωij, is related to the cross-section, σij, through the relation  (2)Collision strengths were averaged over a Maxwellian distribution of electron energies to yield the corresponding effective collision strengths for a range of electron temperatures (Te). The effective collision strength Υij is defined as
  (3)where k is Boltzmann’s constant and Ej is the final energy of the electron after scattering. The temperature of maximum fractional abundance for Mg viii in ionisation equilibrium is Te = 105.9 K (Falconer et al. 1997). A total of 30 temperature points were employed to cover the range from Te = 104–107 K. The effective collision strengths will be presented and discussed in the next section.
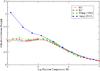 |
Fig. 1 Effective collision strength as a function of logarithmic electron temperature (Te in K) for the 2s22p 2P1/2–2s22p 2P3/2 transition. A solid black line is used for M1, a red line with triangles for M2, a green line with circles for Zhang et al. (1994) and a blue line with squares for Liang et al. (2012). |
3. Results
In this section a variety of effective collision strengths are presented for low-lying transitions. Only transitions amongst the lowest 15 fine-structure levels will be examined as these are the most important and give rise to the large number of observed coronal spectral lines. The forbidden transitions will be presented first, followed by an examination of the dipole-allowed transitions.
First, it is convenient to examine the important transition between the fine-structure levels of the ground state doublet. Figure 1 presents the effective collision strength as a function of electron temperature for this forbidden 2s22p 2P1/2–2s22p 2P3/2 transition. A comparison of the effective collision strengths from M1 and M2 indicates that the additional CI terms included in M2 play a negligible role for this particular transition. From Fig. 1 it can also be seen that the present results compare favourably with those of Zhang et al. (1994). However, the results of Liang et al. (2012) display significant differences with the present work in the low temperature region.
In an attempt to investigate these differences further, the corresponding collision strengths for the 2s22p 2P1/2–2s22p 2P3/2 transition are presented in Fig. 2 for near-threshold energies, where the source of the discrepancy in the effective collision strength profiles can be readily identified. The results of Liang et al. (2012) show several large resonant features at energies just above threshold (0.03–0.1 Ryd), which are absent in M1, M2 and the work of Zhang et al. (1994). The threshold energy for this transition amongst the fine structure split levels of the ground state has been shifted to the experimental value in both the present work and the work of Liang et al. (2012) so the differences do not arise from differing thresholds. As mentioned previously, a similar mesh increment was adopted in the present calculations and the work of Liang et al. (2012), thus there should be no issues with unresolved resonances. The only main difference between the calculations is the inclusion of the n = 4 levels. However, it seems unlikely that these levels would affect such low-energy resonances for only a single transition. The source of the discrepancy remains unclear, although we stress that at the higher temperatures of astrophysical importance there is excellent agreement between the effective collision strength profiles. After a thorough analysis, this was found to be the only transition where noticeable differences were evident in the effective collision strengths produced by the present work and those of Liang et al. (2012).
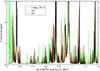 |
Fig. 2 Collision strength as a function of incident electron energy for the 2s22p 2P1/2–2s22p 2P3/2 transition. A black line is used for M1, a red line for M2 and green curve for Liang et al. (2012). |
In general, for the remaining transitions amongst the 5 lowest-lying levels, the M1, M2, Zhang et al. (1994) and Liang et al. (2012) calculations show a good level of agreement. An examination of transitions to levels higher than 2s2p24P5/2 (i.e. level 5) indicate large differences between the present results and those of Zhang et al. (1994). An example is 2s2p24P1/2−2s2p22P1/2, presented in Fig. 3, where it can be seen that the M1, M2 and Liang et al. (2012) calculations are in excellent agreement, but there are major differences with Zhang et al. At the temperature of maximum fractional abundance (Te = 105.9 K) the effective collision strength of Zhang et al. (1994) is 57% lower than the present results. These differences are due to the inclusion of more target states in both the current and Liang et al. (2012) calculations. The Rydberg resonances which converge on the higher target levels, such as 2s23s, 2s23p and 2s23d, give rise to the apparent peak in the present effective collision strengths at 105.9 K. Corresponding collision strengths for the 2s2p24P1/2−2s2p22P1/2 transition are presented in Fig. 4. For this transition, the location and size of the resonances are identical between M1, M2 and Liang et al. (2012). This highlights the high levels of consistency achieved by employing the various R-matrix codes and transformation methods. The good levels of agreement obtained in the comparison also help to verify the accuracy of employing an iso-electronic approach for the B-like sequence.
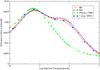 |
Fig. 3 Effective collision strength as a function of logarithmic electron temperature (Te in K) for the forbidden 2s2p24P1/2–2s2p22P1/2 transition. |
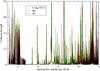 |
Fig. 4 Collision strength as a function of incident electron energy for the 2s2p24P1/2–2s2p22P1/2 transition. |
The peak in the effective collision strengths, due to the additional resonances at higher incident electron energies, is a common difference between the present results and those of Zhang et al. (1994). In Fig. 5 we plot results for the forbidden 2s22p 2P1/2–2p32P3/2 transition, where it is clear that M1 and M2 show a substantial peak at the temperature of maximum fractional abundance, which is absent from the data of Zhang et al. At this temperature, the M1 calculation is 98% larger than Zhang et al., while M2 is 62% larger. The corresponding results of Liang et al. (2012) are in perfect agreement with M1 but reside slightly higher than the M2 effective collision strengths.
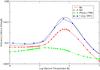 |
Fig. 5 Effective collision strength as a function of logarithimic electron temperature (Te in K) for the 2s22p 2P1/2–2p32P3/2 transition. |
A final example of a forbidden transition is 2s2p24P5/2–2p32P1/2, presented in Fig. 6. Again, the M1 and M2 calculations exhibit a large peak in the effective collision strengths. At the temperature of maximum fractional abundance M1 and M2 are 240% and 180% larger, respectively, than the value predicted by Zhang et al. (1994). The effective collision strengths of Liang et al. (2012) agree well with M1 and lie slightly above the values predicted by M2.
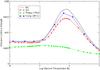 |
Fig. 6 Effective collision strength as a function of logarithmic electron temperature (Te in K) for the 2s2p24P5/2–2p32P1/2 transition. |
An examination of the forbidden transitions highlighted some significant differences between the present results and those of Zhang et al. (1994). However, excellent agreement was generally found between the present results and Liang et al. (2012). Hence it is now prudent to examine the dipole-allowed transitions. As a first example we consider 2s22p 2P1/2–2s2p22D3/2, presented in Fig. 7. As expected, in the vicinity of the temperature of maximum fractional abundance the present results are higher than those of Zhang et al. (1994). Another example, also shown in Fig. 7, is the 2s22p 2P1/2–2s2p22S1/2 transition, for which there is relatively good agreement between all three sets of results, with differences of less than 30%. The remaining dipole-allowed transitions exhibit similar levels of agreement with the results of Zhang et al. For these, the resonant features play a slightly less important role and it is the high background level of the collision strengths which becomes the dominant factor in determining the resulting effective collision strengths. Once again, exceptionally high levels of agreement are found between the present results and those of Liang et al. (2012). In general, the differences between the aforementioned two sets of results are less than 5% for the dipole-allowed transitions.
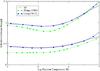 |
Fig. 7 Upper plot: effective collision strength as a function of logarithmic electron temperature (Te in K) for the 2s22p 2P1/2–2s2p22D3/2 transition, lower plot: same for 2s22p 2P1/2–2s2p22S1/2. The solid black line represents the results of M1, the green line with circles is the effective collision strengths of Zhang et al. (1994) and the blue line with squares illustrates the results of Liang et al. (2012). |
Typically, the differences between the M1 and M2 calculations are found to be relatively small. Due to the good agreement between the two models it is hence believed that the additional CI terms included in M2 play a minor role in the determination of the collision strengths. A disadvantage of M2 is the presence of pseudo-resonances for transitions amongst higher levels, although transitions amongst the lowest 20 levels are unaffected. Thus, on balance, it is believed that the M1 calculations provide the most reliable set of effective collision strengths for use in astrophysical modelling. The effective collision strengths for all 7750 forbidden and allowed lines are presented in Table 7.
Relative intensities of Mg viii lines detected in the SERTS–89 active region spectrum.
Relative intensities of Mg viii lines in a SUMER spectrum of the quiet Sun.
4. Emission line intensities
Strong Mg viii emission occurs predominantly in the EUV and soft X-ray regions of the solar spectrum, with the former host to some of the most prominent lines. For example, many emission features have been detected and extensively studied in the 311–437 Å region by the SERTS rocket spectrograph (Thomas & Neupert 1994), while the S082A and S–055 instruments on Skylab found several Mg viii transitions spanning 315−783 Å in a number of solar features including a sunspot, active region and flares (Foster et al. 1997a). Also, SUMER spectra have highlighted the existence of Mg viii lines lying in the 762−790 Å wavelength region (Landi et al. 2002). However, less well-studied is the soft X-ray region (~50–100 Å) for which fewer solar observations exist. Some Mg viii lines have been detected (e.g. Acton et al. 1985), and the present theoretical results indicate that more may be present in this region. Hence our emphasis is on the soft X-ray region and forms the basis of this section.
The present line intensities were calculated using CLOUDY C13 (Ferland et al. 2013). Effective collision strengths were taken from the M1 calculation and transition probabilities from Rynkun et al. (2012) where available. For all other transition probabilities, the M2 calculations were adopted. Excitation by proton impact, which is important for fine-structure transitions within the 2s22p 2P and 2s2p24P multiplets, were taken from Foster et al. (1997b). Unless otherwise specified, an electron density of Ne = 109.8 cm-3 and an electron temperature of Te = 105.9 K were adopted in the subsequent line intensity calculations.
Theoretical soft X-ray emission lines of Mg viii.
Energies for Mg viii in Rydberg.
4.1. The EUV region
The strong EUV lines observed by SERTS are due to E1 transitions amongst the lowest 10 fine-structure levels. As a check on the accuracy of the present collision strength and transition probability data, the observational and theoretical line intensities are compared in Table 3. Only four of the lines in Table 3 have reliable observed intensities. For these, the present theoretical results are all within 12% of the observed values. Also listed in Table 3 are the results predicted by Bhatia & Thomas (1998), which are all within 24% of the observed values.
Young et al. (1998) raised concerns over the calibration of the 430–450 Å region of the SERTS–89 spectrum. It had been proposed that the observed intensities could be too small by a factor of approximately two. This is supported by the present results, which indicate that the SERTS–89 intensities need to be increased by a factor of around 2.1 in this region.
In Table 4 the present theoretical line intensities are also compared with SUMER measurements of an off-disk region of the quiet Sun (Landi et al. 2002), as well as the predictions from CHIANTI v7.0 (Dere et al. 1997; Landi et al. 2012). The present results are all within 17% of the SUMER measurements and provide a slight improvement compared to the CHIANTI values.
Due to the extremely high levels of agreement between the present set of effective collision strengths and those of Liang et al. (2012) it is not expected that there should be any difference between the resultant line intensities. However, as a check, the effective collision strengths of Liang et al. (2012) were also included in CLOUDY, and the line intensities calculated for the EUV region. As expected, these were found to be within 2% of the present results.
4.2. The soft X-ray region
Dwivedi (1990) has highlighted the possible potential of soft X-ray emission lines from ions such as Mg viii as a diagnostic of the electron density in solar plasmas. In Table 5 some of the strongest soft X-ray lines are listed for a plasma with Te = 105.9 K and Ne = 108–1010 cm-3. Only lines which have an intensity relative to I(75.03 Å) of ≥0.05 are listed in the table. In particular, the I(75.03 + 75.04 Å)/I(74.86 Å) intensity ratio provides an excellent density diagnostic, as noted by Brown et al. (1986) and illustrated in Fig. 8. The ratio shows little sensitivity to Te but varies by a factor of 4 over the density interval Ne = 106–109 cm-3. Also shown in Fig. 8 is the measured line ratio of 1.9 for an M-class flare (Acton et al. 1985). This is close to the high density limit, in agreement with other density diagnostics for this flare which indicate Ne > 1010 cm-3 (Brown et al. 1986).
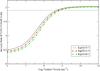 |
Fig. 8 The I(75.03 + 75.04 Å)/I(74.86 Å) line intensity ratio plotted as a function of logarithmic electron density (Ne in cm-3) at logarithmic electron temperatures (Te in K) of log Te = 5.7, 5.9 and 6.1. The black dashed line represents the observed value, from the solar flare spectrum of Acton et al. (1985). |
Another potentially useful density diagnostic is I(86.84 Å)/ I(87.02 Å), shown in Fig. 9. Raassen et al. (2002) found an experimental value for this ratio of 1.2 from the Chandra spectrum of Procyon. From Fig. 9 this indicates Ne ≃ 108 cm-3, far lower than the characteristic coronal density of Procyon which is ~3 × 109 cm-3 (Schmitt et al. 1996). However, Raassen et al. note that the 87.02 Å feature of Mg viii is blended with an Fe xi transition, which a theoretical spectrum generated from CHIANTI indicates should contribute ~20% to the total measured line intensity. Correcting for this, we determine a revised I(86.84 Å)/I(87.02 Å) ratio of ~1.5 which implies Ne ≃ 109 cm-3, in better agreement with the density derived from other diagnostics by Schmitt et al. (1996).
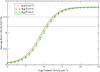 |
Fig. 9 The I(86.84 Å)/I(87.02 Å) line intensity ratio plotted as a function of logarithmic electron density (Ne in cm-3) at logarithmic electron temperatures (Te in K) of log Te = 5.7, 5.9 and 6.1. The experimental ratio of 1.2 from the Chandra spectrum of Procyon (Raassen et al. 2002) is plotted as a dashed line, while the ratio corrected for the presence of an Fe xi blend in the 87.02 Å feature (1.5) is shown as a dashed-dot line. |
5. Conclusions
Collision strengths have been produced using two models (M1 and M2) for all 7750 transitions amongst 125 fine-structure levels of Mg viii. These were averaged over a Maxwellian distribution of electron velocities to produce the corresponding effective collision strengths. A comparison of the two models indicated that, in general, the differences were relatively small. The additional CI terms in M2 did not influence the effective collision strengths in any significant manner. As pseudo-resonances were present in some of the higher-lying transitions in M2, it was assessed that the M1 calculation was overall the best. A comparison of the present results with Zhang et al. (1994) for the dipole-allowed transitions indicated generally good agreement between the two calculations. However, a comparison of forbidden transitions highlighted large differences of up to 240%. The present results for both dipole-allowed and forbidden transitions compared very favourably with Liang et al. (2012). Typically, any differences were less than 15% for the forbidden transitions and 5% for the dipole-allowed transitions. The present transition probabilities were also compared with the extensive calculation of Rynkun et al. (2012), and very good agreement was found.
Effective collision strengths from M1 were chosen for the calculation of relative Mg viii emission line strengths, and incorporated into the CLOUDY C13 code along with the transition probabilities of Rynkun et al. (2012) and heavy particle excitation rates of Foster et al. (1997b). Good agreement was found between the theoretical EUV line intensities and SUMER and SERTS–89 solar measurements, with differences of less than 17%. Intensities for the strongest soft X-ray lines were also calculated and several density sensitive line ratios presented, which compared favourably with the limited observational data available. However, it is hoped that the present work will encourage further examination of the Mg viii lines in soft X-ray solar and stellar spectra.
Acknowledgments
The authors acknowledge the years of work and dedication of V. M. Burke and C. J. Noble of Daresbury Laboratory (UK) in developing the RMATRXII suite of codes used in the internal region calculation. The authors also wish to acknowledge G. J. Ferland and M. Lykins of the University of Kentucky (USA) for extending CLOUDY to facilitate direct inclusion of our atomic data. The authors would like to thank the referee for bringing the work of Liang et al. (2012) directly to our attention. Our thanks is also extended to G. Y. Liang for the provision of collision strengths for comparative purposes. The work presented in this paper is supported by STFC and the Leverhulme Trust. M. F. R. Grieve is funded by a DEL studentship. CHIANTI is a collaborative project involving George Mason University, the University of Michigan (USA) and the University of Cambridge (UK).
References
- Acton, L. W., Bruner, M. E., Brown, W. A., et al. 1985, ApJ, 291, 865 [NASA ADS] [CrossRef] [Google Scholar]
- Ballance, C. P., & Griffin, D. C. 2004, J. Phys. B, 37, 2943 [NASA ADS] [CrossRef] [Google Scholar]
- Behring, W. E., Cohen, L., & Feldman, U. 1972, ApJ, 175, 493 [NASA ADS] [CrossRef] [Google Scholar]
- Bhatia, A. K., & Thomas, R. J. 1998, ApJ, 497, 483 [NASA ADS] [CrossRef] [Google Scholar]
- Brosius, J. W., Thomas, R. J., & Davila, J. M. 2000, ApJ, 543, 1016 [NASA ADS] [CrossRef] [Google Scholar]
- Brown, W. A., Bruner, M. E., Acton, L. W., & Mason, H. E. 1986, ApJ, 301, 981 [NASA ADS] [CrossRef] [Google Scholar]
- Burke, P. G., Burke, V. M., & Dunseath, K. M. 1994, J. Phys. B At. Mol. Opt. Phys., 27, 5341 [Google Scholar]
- Clementi, E., & Roetti, C. 1974, At. Data Nucl. Data Tables, 14, 3 [Google Scholar]
- Curdt, W., Landi, E., & Feldman, U. 2004, A&A, 427, 1045 [NASA ADS] [CrossRef] [EDP Sciences] [Google Scholar]
- Dere, K. P., Landi, E., Mason, H. E., Monsignori Fossi, B. C., & Young, P. R. 1997, A&AS, 125, 149 [NASA ADS] [CrossRef] [EDP Sciences] [Google Scholar]
- Dwivedi, B. N. 1990, High Resolution X-ray Spectroscopy of Cosmic Plasmas, IAU Colloq., 115, 40 [NASA ADS] [Google Scholar]
- Dwivedi, B. N., & Mohan, A. 1995, Sol. Phys., 156, 81 [NASA ADS] [CrossRef] [Google Scholar]
- Falconer, D. A., Davila, J. M., & Thomas, R. J. 1997, ApJ, 482, 1050 [NASA ADS] [CrossRef] [Google Scholar]
- Ferland, G. J., Porter, R. L., van Hoof, P. A. M., et al. 2013, Rev. Mex. Astron. Astrophys., 49, 137 [Google Scholar]
- Foster, V. J., Keenan, F. P., Reid, R. H. G., et al. 1997a, Sol. Phys., 170, 217 [NASA ADS] [CrossRef] [Google Scholar]
- Foster, V. J., Keenan, F. P., & Reid, R. H. G. 1997b, ADNDT, 67, 99 [Google Scholar]
- Hibbert, A. 1975, Comput. Phys. Commun., 9, 141 [NASA ADS] [CrossRef] [Google Scholar]
- Landi, E., Feldman, U., & Dere, K. P. 2002, ApJ Suppl., 139, 281 [Google Scholar]
- Landi, E., Del Zanna, G., Young, P. R., Dere, K. P., & Mason, H. E. 2012, ApJ, 744, 99 [NASA ADS] [CrossRef] [Google Scholar]
- Liang, G. Y., Badnell, N. R., & Zhao, G. 2012, A&A, 547, A87 [NASA ADS] [CrossRef] [EDP Sciences] [Google Scholar]
- Malinovsky, L., & Heroux, M. 1973, ApJ, 181, 1009 [NASA ADS] [CrossRef] [Google Scholar]
- Martin, W. C., & Zalubas, R. 1980, J. Phys. Chem. Ref. Data, 9, 1 [NASA ADS] [CrossRef] [Google Scholar]
- Prieto, M. A., & Viegas, M. 2000, ApJ, 532, 238 [NASA ADS] [CrossRef] [Google Scholar]
- Raassen, A. J. J., Mewe, R., Audard, M., et al. 2002, A&A, 389, 228 [NASA ADS] [CrossRef] [EDP Sciences] [Google Scholar]
- Ralchenko, Y., Jou, F.-C., Kelleher, D. E., et al. 2011, NIST Atomic Spectra Database, version 4.1.0., National Institute of Standards and Technology, Gaithersburg, MD, http://physics.nist.gov/asd [Google Scholar]
- Reconditi, M., & Oliva, E. 1993, A&A, 274, 662 [NASA ADS] [Google Scholar]
- Rynkun, P., Jonsson, P., Gaigalas, G., & Froese Fischer, C. 2012, At. Data Nucl. Data Tables, 98, 481 [Google Scholar]
- Schmitt, J. H. M. M., Drake, J. J., Haisch, B. M., & Stern, R. A. 1996, ApJ, 467, 841 [NASA ADS] [CrossRef] [Google Scholar]
- Thomas, R. J., & Neupert, W. M. 1994, ApJS, 91, 461 [NASA ADS] [CrossRef] [Google Scholar]
- Vernazza, J. E., & Reeves, E. M. 1978, ApJS, 37, 485 [NASA ADS] [CrossRef] [Google Scholar]
- Werner, K., & Drake, J. J. 2005, A&A, 434, 707 [NASA ADS] [CrossRef] [EDP Sciences] [Google Scholar]
- Young, P. R., Landi, E., & Thomas, R. J. 1998, A&A, 329, 291 [NASA ADS] [Google Scholar]
- Zhang, H. L., Graziani, M., & Pradhan, A. K. 1994, A&A, 283, 319 [NASA ADS] [Google Scholar]
All Tables
Orbital parameters (ci, pi, ξi) obtained using CIV3 for the 3s, 3p, 3d, , and orbitals.
Transition probabilities (in s-1) for E1 transitions in Mg viii from Model 1 and Model 2 calculations.
Relative intensities of Mg viii lines detected in the SERTS–89 active region spectrum.
All Figures
|
Fig. 1 Effective collision strength as a function of logarithmic electron temperature (Te in K) for the 2s22p 2P1/2–2s22p 2P3/2 transition. A solid black line is used for M1, a red line with triangles for M2, a green line with circles for Zhang et al. (1994) and a blue line with squares for Liang et al. (2012). |
| In the text | |
|
Fig. 2 Collision strength as a function of incident electron energy for the 2s22p 2P1/2–2s22p 2P3/2 transition. A black line is used for M1, a red line for M2 and green curve for Liang et al. (2012). |
| In the text | |
|
Fig. 3 Effective collision strength as a function of logarithmic electron temperature (Te in K) for the forbidden 2s2p24P1/2–2s2p22P1/2 transition. |
| In the text | |
|
Fig. 4 Collision strength as a function of incident electron energy for the 2s2p24P1/2–2s2p22P1/2 transition. |
| In the text | |
|
Fig. 5 Effective collision strength as a function of logarithimic electron temperature (Te in K) for the 2s22p 2P1/2–2p32P3/2 transition. |
| In the text | |
|
Fig. 6 Effective collision strength as a function of logarithmic electron temperature (Te in K) for the 2s2p24P5/2–2p32P1/2 transition. |
| In the text | |
|
Fig. 7 Upper plot: effective collision strength as a function of logarithmic electron temperature (Te in K) for the 2s22p 2P1/2–2s2p22D3/2 transition, lower plot: same for 2s22p 2P1/2–2s2p22S1/2. The solid black line represents the results of M1, the green line with circles is the effective collision strengths of Zhang et al. (1994) and the blue line with squares illustrates the results of Liang et al. (2012). |
| In the text | |
|
Fig. 8 The I(75.03 + 75.04 Å)/I(74.86 Å) line intensity ratio plotted as a function of logarithmic electron density (Ne in cm-3) at logarithmic electron temperatures (Te in K) of log Te = 5.7, 5.9 and 6.1. The black dashed line represents the observed value, from the solar flare spectrum of Acton et al. (1985). |
| In the text | |
|
Fig. 9 The I(86.84 Å)/I(87.02 Å) line intensity ratio plotted as a function of logarithmic electron density (Ne in cm-3) at logarithmic electron temperatures (Te in K) of log Te = 5.7, 5.9 and 6.1. The experimental ratio of 1.2 from the Chandra spectrum of Procyon (Raassen et al. 2002) is plotted as a dashed line, while the ratio corrected for the presence of an Fe xi blend in the 87.02 Å feature (1.5) is shown as a dashed-dot line. |
| In the text | |
Current usage metrics show cumulative count of Article Views (full-text article views including HTML views, PDF and ePub downloads, according to the available data) and Abstracts Views on Vision4Press platform.
Data correspond to usage on the plateform after 2015. The current usage metrics is available 48-96 hours after online publication and is updated daily on week days.
Initial download of the metrics may take a while.