Fig. 3
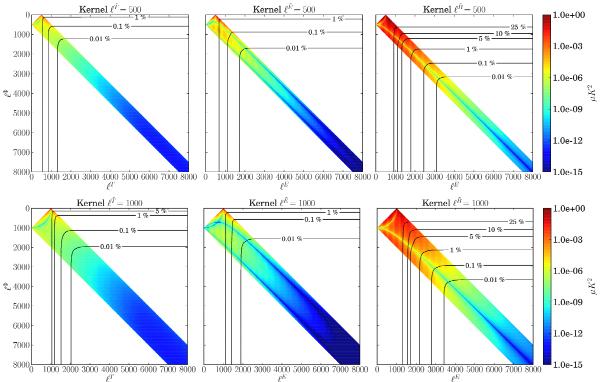
Lensing kernels  for
X = Y = T, left column,
X = Y = E, middle, and
X = B,Y = E, right, for two
different values of the multiple number of the lensed signal,
for
X = Y = T, left column,
X = Y = E, middle, and
X = B,Y = E, right, for two
different values of the multiple number of the lensed signal,
 , top to bottom. The
color scale shows the logarithm of the kernel elements and ranges from dark blue
~ 10-15 to ~1, dark red. The solid-line contours show
the best achievable precision of the estimated lensed spectrum, that can be obtained
if the bandwidths of the E and/or Φ unlensed spectra are truncated
to ℓ E and
ℓ Φ. The contours range from 25% to 0.01% from left
to right. The precision is computed with respect to the lensed multipoles calculated
with
, top to bottom. The
color scale shows the logarithm of the kernel elements and ranges from dark blue
~ 10-15 to ~1, dark red. The solid-line contours show
the best achievable precision of the estimated lensed spectrum, that can be obtained
if the bandwidths of the E and/or Φ unlensed spectra are truncated
to ℓ E and
ℓ Φ. The contours range from 25% to 0.01% from left
to right. The precision is computed with respect to the lensed multipoles calculated
with  .
.
Current usage metrics show cumulative count of Article Views (full-text article views including HTML views, PDF and ePub downloads, according to the available data) and Abstracts Views on Vision4Press platform.
Data correspond to usage on the plateform after 2015. The current usage metrics is available 48-96 hours after online publication and is updated daily on week days.
Initial download of the metrics may take a while.