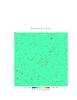
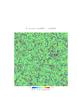
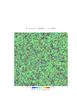
Fig. 12
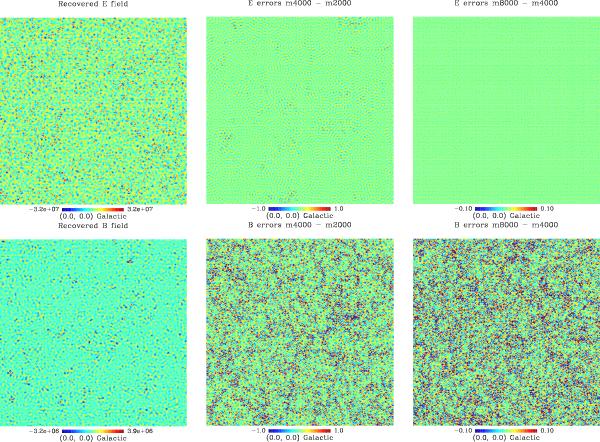
Maps of the recovered χE
(upper row) and χB
(lower row) fields as defined in Zaldarriaga & Seljak (1997) (left column) and
difference maps normalized by the input map rms,
 ,
Eq. (23), computed for
(ℓmax,1,ℓmax,2) = (4000,2000)
(middle column) and
(ℓmax,1,ℓmax,2) = (8000,4000)
(right). There is a factor of 10 difference between the color
scales of the middle and left column.
,
Eq. (23), computed for
(ℓmax,1,ℓmax,2) = (4000,2000)
(middle column) and
(ℓmax,1,ℓmax,2) = (8000,4000)
(right). There is a factor of 10 difference between the color
scales of the middle and left column.
Current usage metrics show cumulative count of Article Views (full-text article views including HTML views, PDF and ePub downloads, according to the available data) and Abstracts Views on Vision4Press platform.
Data correspond to usage on the plateform after 2015. The current usage metrics is available 48-96 hours after online publication and is updated daily on week days.
Initial download of the metrics may take a while.