Fig. 1
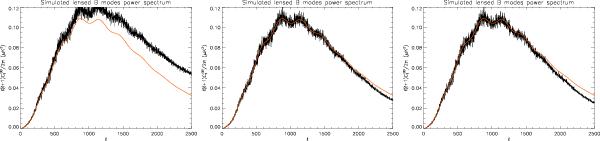
Examples of the CMB B-modes lensing calculation and involved numerical effects. All panels show the recovered B-modes power spectrum overplotted over the theoretical B-mode spectrum computed with CAMB (color line). The bandwidth of the E-modes and the potential Φ is the same in all the panels and set to 2500, while the resolution of the maps used for simulating the lensed signal increases progressively from left to right. ECP pixelization has been used in all cases. The recovered B-spectrum overestimates the theoretical curve in the left panel due to the power-aliasing effect, while it underestimates it in the result recovered for much higher resolution as shown on the right. The nearly perfect recovery shown in the middle panel is merely accidental and results from the insufficient signal bandwidth (right panel) that compensates the extra contribution of the aliasing effect (left panel). The spectrum in the right panel is aliasing-free because it does not change anymore with the increasing resolution.
Current usage metrics show cumulative count of Article Views (full-text article views including HTML views, PDF and ePub downloads, according to the available data) and Abstracts Views on Vision4Press platform.
Data correspond to usage on the plateform after 2015. The current usage metrics is available 48-96 hours after online publication and is updated daily on week days.
Initial download of the metrics may take a while.