Fig. 7
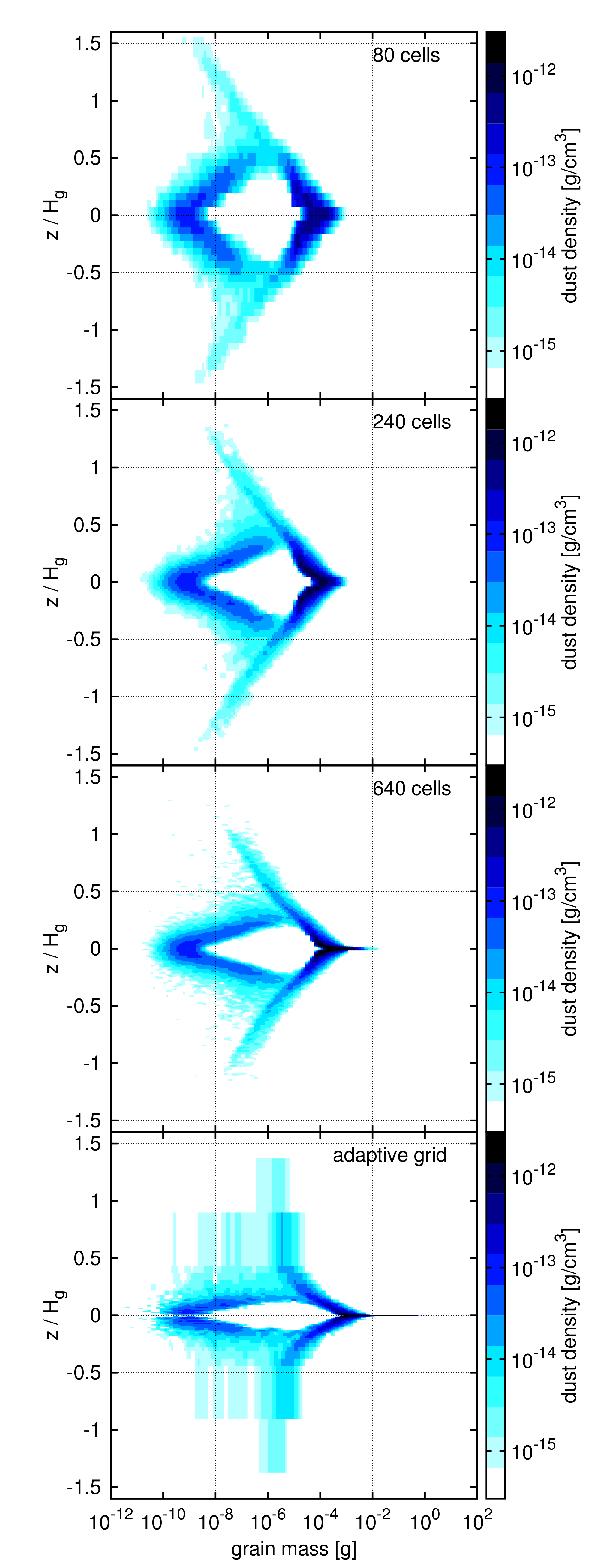
Vertical distribution of the dust grains of different sizes for the 1D sedimentation driven coagulation test. The three upper panels show the result of simulations with constant grid with growing number of cells. The bottom panel uses the adaptive grid routine described in this work with 100 cells. All the distributions were plotted after 1000 yrs of the evolution. The numerical convergence of results is noticeable.
Current usage metrics show cumulative count of Article Views (full-text article views including HTML views, PDF and ePub downloads, according to the available data) and Abstracts Views on Vision4Press platform.
Data correspond to usage on the plateform after 2015. The current usage metrics is available 48-96 hours after online publication and is updated daily on week days.
Initial download of the metrics may take a while.