Fig. 5
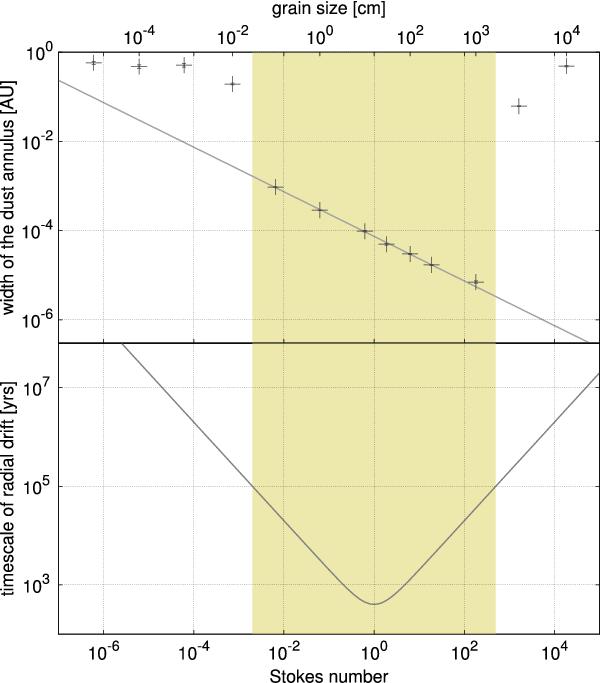
Top panel: analytically derived dependence for the trapped dust annulus width (Eq. (35), line) and the results of test runs (points). The timescale of particles trapping is associated with the timescale of radial drift. The latter is specified on the lower plot (Eq. (34)). The points on the top panel were measured after 105 years of evolution. This indicates a range of Stokes numbers of particles that can be trapped (marked with different background color).
Current usage metrics show cumulative count of Article Views (full-text article views including HTML views, PDF and ePub downloads, according to the available data) and Abstracts Views on Vision4Press platform.
Data correspond to usage on the plateform after 2015. The current usage metrics is available 48-96 hours after online publication and is updated daily on week days.
Initial download of the metrics may take a while.