Fig. 3
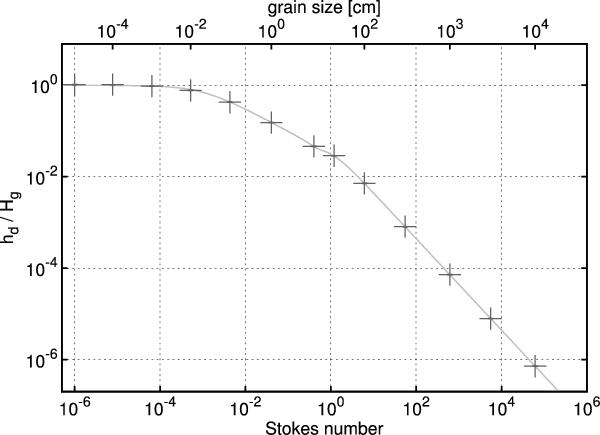
Results of the vertical settling and turbulent diffusion test. The theoretical dependence given by Eq. (29) is plotted with the solid line. The change of the slope around St = 0.5 comes from the Stokes number restriction applied in Eq. (12). The test simulations results are marked with points. We find a good agreement between the analytical prediction and the tests results.
Current usage metrics show cumulative count of Article Views (full-text article views including HTML views, PDF and ePub downloads, according to the available data) and Abstracts Views on Vision4Press platform.
Data correspond to usage on the plateform after 2015. The current usage metrics is available 48-96 hours after online publication and is updated daily on week days.
Initial download of the metrics may take a while.