Fig. 12
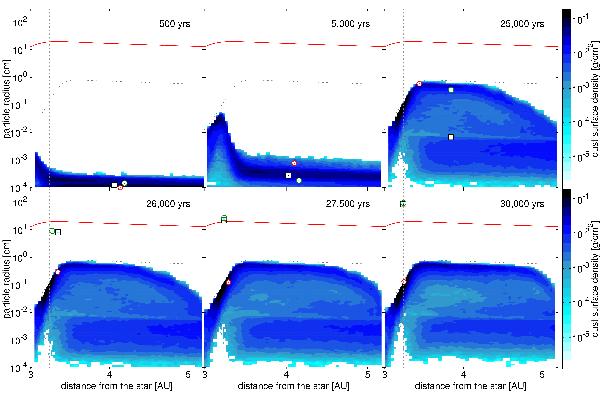
Vertically integrated dust density at different stages of the evolution, using collision model B. The solid line shows the particle size corresponding to the Stokes number of unity, where the drift is the fastest. This line is also proportional to the gas surface density. The dashed line shows approximate position of the bouncing barrier. The dotted line indicates the location of the pressure trap. The symbols point the position of three selected representative particles. Two of them are the particles that become the seeds that continue growing, trapped in the pressure trap at 3.23 AU, while the growth of the other swarms is stopped by the bouncing barrier. The feature at r > 3.5 AU and a < 10-2 cm comes from the bimodal distribution revealed in the 1D tests (see Sect. 4), where the small particles are vertically dispersed, while the bigger particles resides in the midplane of the disk.
Current usage metrics show cumulative count of Article Views (full-text article views including HTML views, PDF and ePub downloads, according to the available data) and Abstracts Views on Vision4Press platform.
Data correspond to usage on the plateform after 2015. The current usage metrics is available 48-96 hours after online publication and is updated daily on week days.
Initial download of the metrics may take a while.