Fig. 1
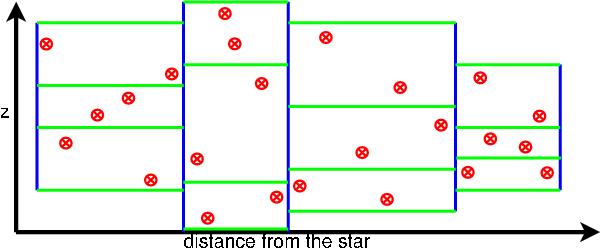
Illustration of the adaptive grid algorithm. The dots correspond to the representative particles. First the vertical (blue in color version) walls are established so that the number of the representative particles in each radial zone is equal. Then the horizontal (green) walls are set up for each radial zone individually in order to preserve equal number of swarms in each cell.
Current usage metrics show cumulative count of Article Views (full-text article views including HTML views, PDF and ePub downloads, according to the available data) and Abstracts Views on Vision4Press platform.
Data correspond to usage on the plateform after 2015. The current usage metrics is available 48-96 hours after online publication and is updated daily on week days.
Initial download of the metrics may take a while.