Free Access
Fig. 3
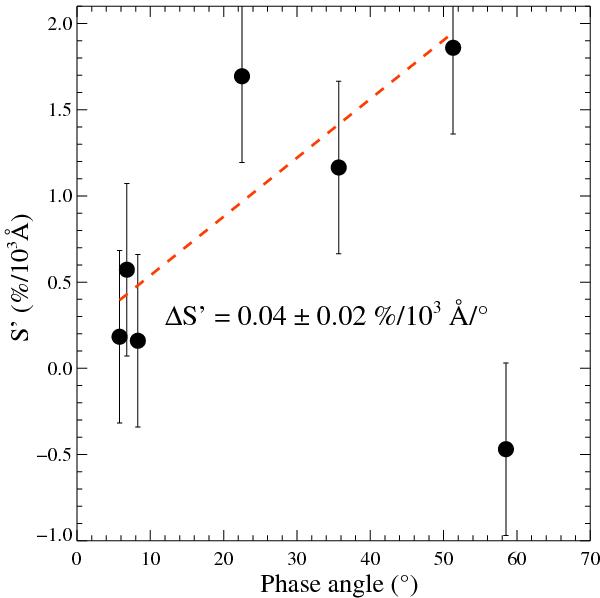
Spectral slope S′ computed for the near-infrated spectra vs. phase angle (α). The represented values are listed in Table 1. The red-dashed line corresponds to a linear fit to the points (excepting the point at the low-right part of the plot), with ΔS′ being the slope of that linear fit.
Current usage metrics show cumulative count of Article Views (full-text article views including HTML views, PDF and ePub downloads, according to the available data) and Abstracts Views on Vision4Press platform.
Data correspond to usage on the plateform after 2015. The current usage metrics is available 48-96 hours after online publication and is updated daily on week days.
Initial download of the metrics may take a while.