Fig. 5
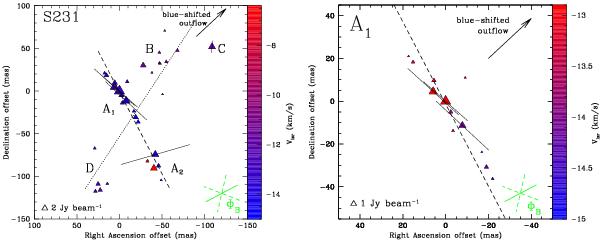
Left panel: view of the CH3OH maser features detected around S231 (Table A.4). Right panel: zoom-in view of group A1. Same symbols as in Fig. 2. The arrow indicates the direction of the blue-shifted lobe of the H2-outflow (PAout = 133°; Ginsburg et al. 2009).The dashed line is the best linear fit of the CH3OH maser features of group A ( °), while the dotted line is the best linear fit of the CH3OH maser features of groups B, C, and D (
 °).
°).
Current usage metrics show cumulative count of Article Views (full-text article views including HTML views, PDF and ePub downloads, according to the available data) and Abstracts Views on Vision4Press platform.
Data correspond to usage on the plateform after 2015. The current usage metrics is available 48-96 hours after online publication and is updated daily on week days.
Initial download of the metrics may take a while.