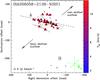
Fig. 2

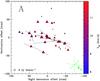
Left panel: view of the CH3OH maser features detected around IRAS 06058+2138-NIRS 1 (Table A.1). Triangles symbols identify CH3OH maser features scaled logarithmically according to their peak flux density (Table A.1). Maser LSR radial velocities are indicated by color (the assumed velocity of the YSO is  km s-1, Saito et al. 2007). A 4 Jy beam-1 symbol is plotted for illustration. The linear polarization vectors, scaled logarithmically according to polarization fraction Pl, are overplotted. On the right-bottom corner the error weighted orientation of the magnetic field (ΦB, see Sect. 6.2.1) is also reported, the two dashed segments indicates the uncertainty. The two arrows indicate the direction of the red- and blue-shifted lobe of the bipolar outflow (PAout = 130°; Wu et al. 2010). The dashed line is the best linear fit of the CH3OH maser features of group A (PACH3OH = 78° ± 7°). Right panel: zoom-in view of group A.
Current usage metrics show cumulative count of Article Views (full-text article views including HTML views, PDF and ePub downloads, according to the available data) and Abstracts Views on Vision4Press platform.
Data correspond to usage on the plateform after 2015. The current usage metrics is available 48-96 hours after online publication and is updated daily on week days.
Initial download of the metrics may take a while.