Fig. 6
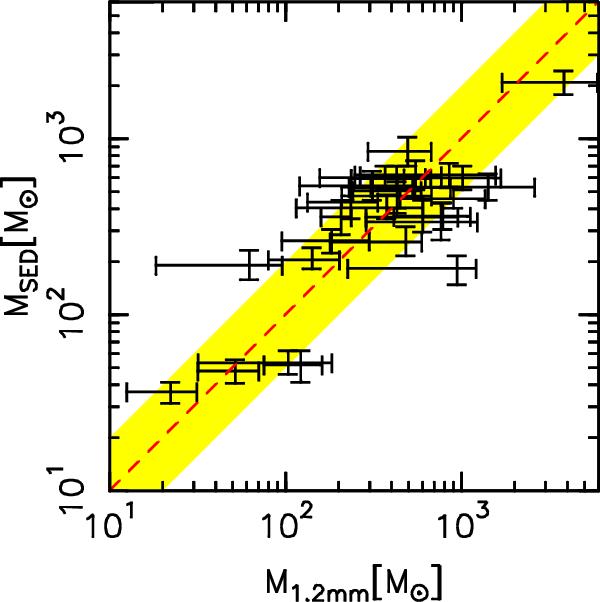
Comparison between the mass derived from the 1.2 mm continuum and from the SED fit. The uncertainties in MSED are indicated. The bars for the 1.2 mm continuum range from the lower limit of the mass within the FWHM contour to the upper limit of the 3σ contour. The dashed line indicates equal masses and the yellow-shaded region shows a difference of a factor of two.
Current usage metrics show cumulative count of Article Views (full-text article views including HTML views, PDF and ePub downloads, according to the available data) and Abstracts Views on Vision4Press platform.
Data correspond to usage on the plateform after 2015. The current usage metrics is available 48-96 hours after online publication and is updated daily on week days.
Initial download of the metrics may take a while.