Free Access
Fig. 5
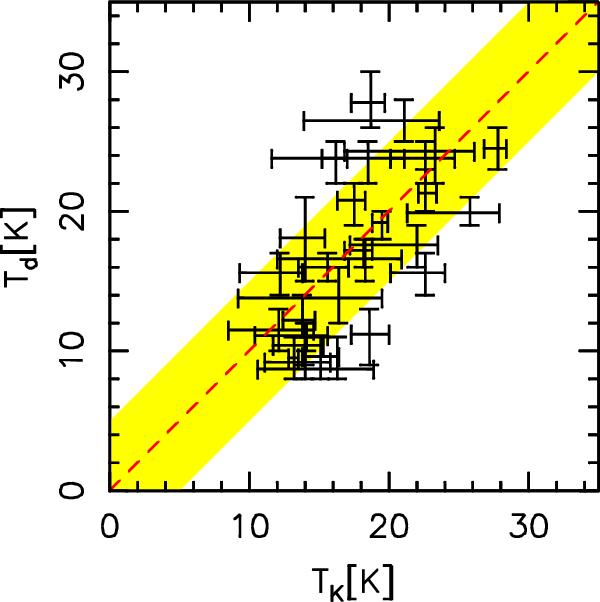
Comparison between the kinetic temperature (TK) derived from ammonia and the dust temperature (Td) from the SED-fit. The dashed line indicates equal temperatures and the yellow-shaded region shows a difference of ± 5 K between the two temperatures.
Current usage metrics show cumulative count of Article Views (full-text article views including HTML views, PDF and ePub downloads, according to the available data) and Abstracts Views on Vision4Press platform.
Data correspond to usage on the plateform after 2015. The current usage metrics is available 48-96 hours after online publication and is updated daily on week days.
Initial download of the metrics may take a while.