Fig. 3
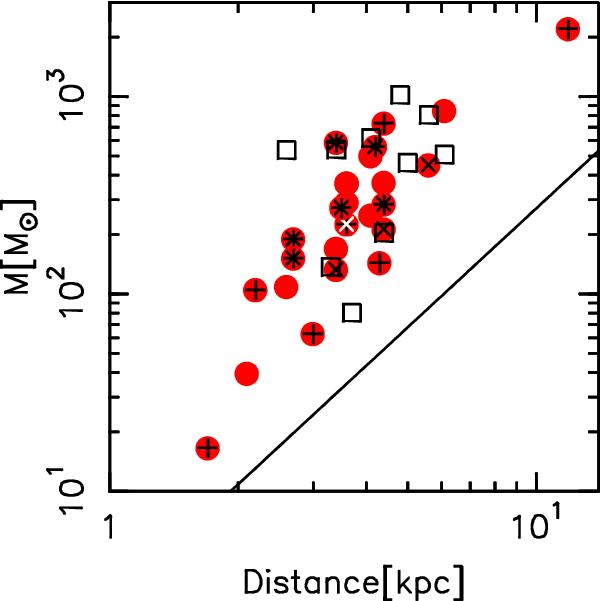
Mass of the clumps as a function of distance. The black solid line indicates the typical mass sensitivity for the SEST images (see text). The sources with signs of active star formation are shown as red filled circles, those without as black open squares (see Sect. 5). Associated MSX emission is indicated as a black plus, and radio-continuum emission as a black cross. The white cross indicates 17195–3811c1 (see text).
Current usage metrics show cumulative count of Article Views (full-text article views including HTML views, PDF and ePub downloads, according to the available data) and Abstracts Views on Vision4Press platform.
Data correspond to usage on the plateform after 2015. The current usage metrics is available 48-96 hours after online publication and is updated daily on week days.
Initial download of the metrics may take a while.