Free Access
Fig. 19
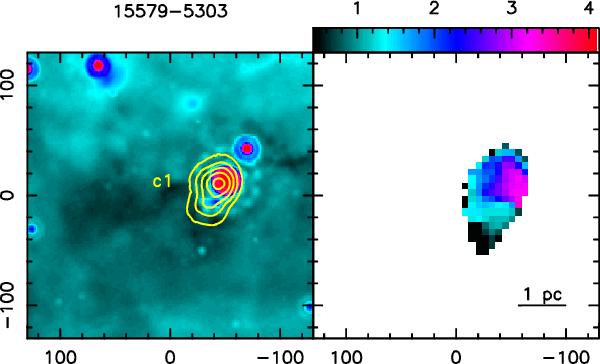
Example of NH3(1, 1) second moment map. Left panel shows Spitzer/MIPSGAL 24 μm image in colourscale and NH3(1, 1) integrated emission in contours, while the right panel shows the second moment map.
Current usage metrics show cumulative count of Article Views (full-text article views including HTML views, PDF and ePub downloads, according to the available data) and Abstracts Views on Vision4Press platform.
Data correspond to usage on the plateform after 2015. The current usage metrics is available 48-96 hours after online publication and is updated daily on week days.
Initial download of the metrics may take a while.