Free Access
Fig. 17
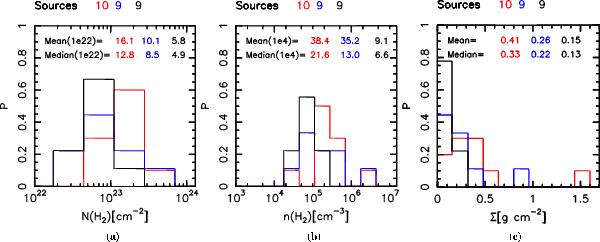
Normalized histograms of a) column-, b) volume- and c) surface-densities of molecular hydrogen averaged within the FWHM contour. We show the SFS-2 in red, SFS-1 in blue and the QS in black. The total number of sources in each class is shown above the panels.
Current usage metrics show cumulative count of Article Views (full-text article views including HTML views, PDF and ePub downloads, according to the available data) and Abstracts Views on Vision4Press platform.
Data correspond to usage on the plateform after 2015. The current usage metrics is available 48-96 hours after online publication and is updated daily on week days.
Initial download of the metrics may take a while.