Fig. 12
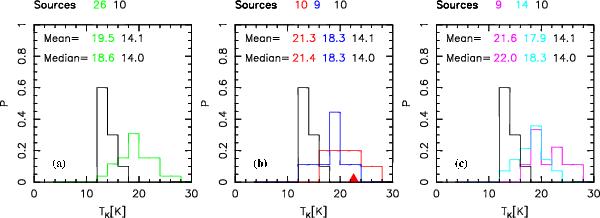
Normalized histogram (to the total number of sources in each class) of kinetic temperature for a) the SFS (green), and the QS (black); b) the same as a), but the SFS-2, with L > 103 L⊙ (in red) are separated from the SFS-1 (in blue), the red triangle shows the temperature for the Type 3 source; c) the same as a), but the SFS was divided into clumps with (magenta) and without (cyan) radio-continuum emission. Mean and median values of the temperature are indicated in each panel. The total number of sources in each class is shown above each panel.
Current usage metrics show cumulative count of Article Views (full-text article views including HTML views, PDF and ePub downloads, according to the available data) and Abstracts Views on Vision4Press platform.
Data correspond to usage on the plateform after 2015. The current usage metrics is available 48-96 hours after online publication and is updated daily on week days.
Initial download of the metrics may take a while.