Fig. 10
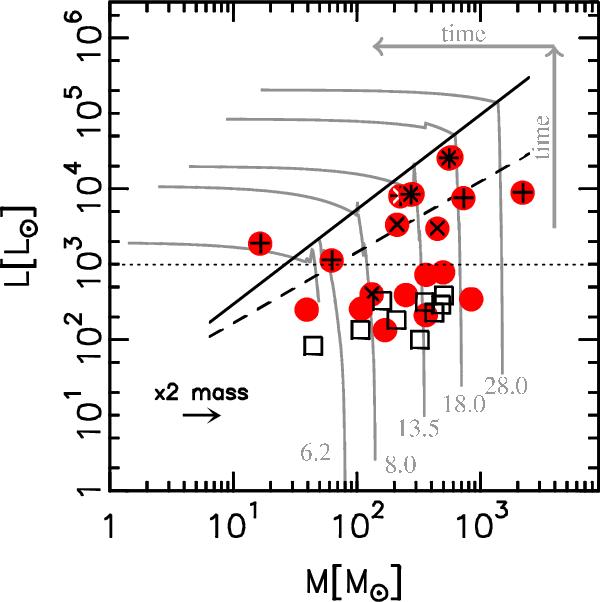
Mass-luminosity plot for the sources in our sample with Hi-GAL observations. The mass is computed within the FWHM contour of 1.2 mm emission. The symbols are the same as in Fig. 3. The black solid line indicates the ZAMS locus, according to Molinari et al. (2008), while the dashed line indicates the ZAMS locus as determined by Urquhart et al. (2013). The grey lines show the evolution of cores of different masses; the lines are labeled with the final mass of the most massive star (in M⊙). Time increases from bottom to top and from right to left, as indicated. Radio-continuum emission and MSX emission are found nearly exclusively in clumps near the ZAMS. A variation of a factor of 2 in mass (see text) is indicated in the bottom left corner.
Current usage metrics show cumulative count of Article Views (full-text article views including HTML views, PDF and ePub downloads, according to the available data) and Abstracts Views on Vision4Press platform.
Data correspond to usage on the plateform after 2015. The current usage metrics is available 48-96 hours after online publication and is updated daily on week days.
Initial download of the metrics may take a while.