Fig. 4
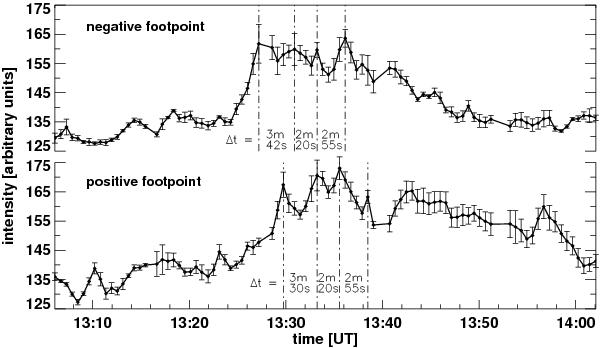
Temporal evolution of the 1216 Å emission at locations of the emerging feature that are associated with strongest photospheric magnetic field (upper curve: negative polarity; lower curve: positive polarity). The standard deviation for each intensity value is marked by errorbars. Different values of Δt depict individual time intervals between consecutive intensity peaks.
Current usage metrics show cumulative count of Article Views (full-text article views including HTML views, PDF and ePub downloads, according to the available data) and Abstracts Views on Vision4Press platform.
Data correspond to usage on the plateform after 2015. The current usage metrics is available 48-96 hours after online publication and is updated daily on week days.
Initial download of the metrics may take a while.