Free Access
Fig. 3
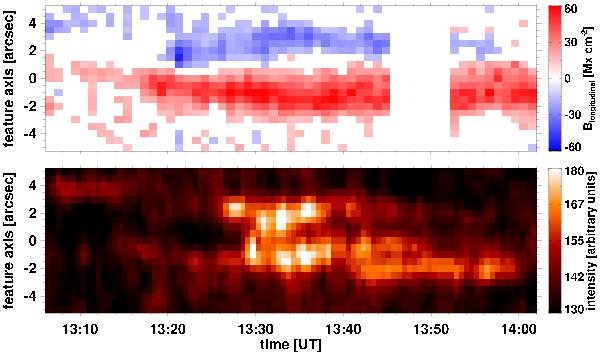
Space-time maps showing the evolution of longitudinal magnetic flux densities and chromospheric emission along the axis connecting the two patches of opposite magnetic polarity of the emerging feature. (This figure is available in color in electronic form.)
Current usage metrics show cumulative count of Article Views (full-text article views including HTML views, PDF and ePub downloads, according to the available data) and Abstracts Views on Vision4Press platform.
Data correspond to usage on the plateform after 2015. The current usage metrics is available 48-96 hours after online publication and is updated daily on week days.
Initial download of the metrics may take a while.