Fig. 1
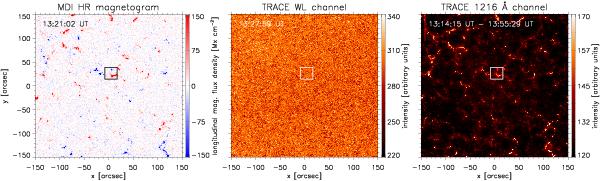
Context images showing the common FoV for all observations. Left panel: SoHO/MDI magnetogram at the best visibility of the emerging feature. The color scale is in Mx cm-2 with red (blue) indicating positive (negative) polarity. An artificial saturation at ±150 Mx cm-2 has been chosen to highlight regions of weak magnetic polarity on the solar surface. Middle panel: image taken in the TRACE white-light channel during the emergence of the analyzed feature demonstrating the absence of strong magnetic fields in the FoV (quiet Sun). Right panel: temporal average of TRACE images taken in the 1216 Å channel during the feature emergence showing long-living chromospheric network elements. Squares enclose the region enlarged in Fig. 2. (This figure is available in color in electronic form.)
Current usage metrics show cumulative count of Article Views (full-text article views including HTML views, PDF and ePub downloads, according to the available data) and Abstracts Views on Vision4Press platform.
Data correspond to usage on the plateform after 2015. The current usage metrics is available 48-96 hours after online publication and is updated daily on week days.
Initial download of the metrics may take a while.