Fig. 5
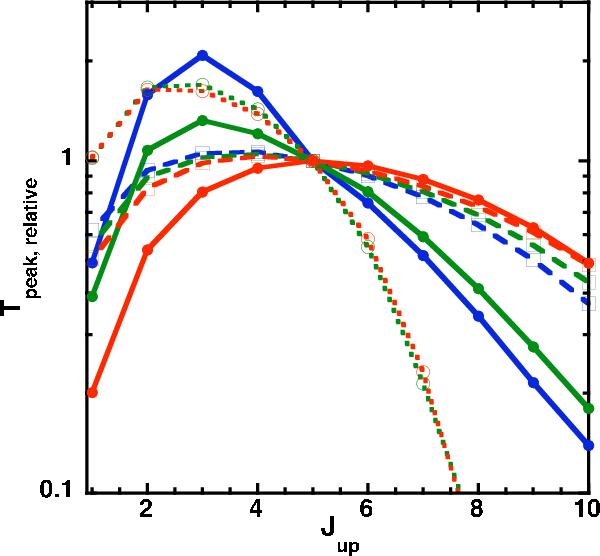
Peak temperatures (K) of the rotational emission lines of SiO, relative to the J = 5–4 transition, as functions of the rotational quantum number of the upper level of the transition Jup. Displayed are the shock models in our grid that are most strongly influenced by vaporization, i.e. Vs = 20 km s-1 with b = 1 (blue), Vs = 30 km s-1 with b = 1.5 (green), and Vs = 40 km s-1 with b = 2 (red). Full lines: M1; dotted lines: M2; broken lines: M3.
Current usage metrics show cumulative count of Article Views (full-text article views including HTML views, PDF and ePub downloads, according to the available data) and Abstracts Views on Vision4Press platform.
Data correspond to usage on the plateform after 2015. The current usage metrics is available 48-96 hours after online publication and is updated daily on week days.
Initial download of the metrics may take a while.