Fig. 4
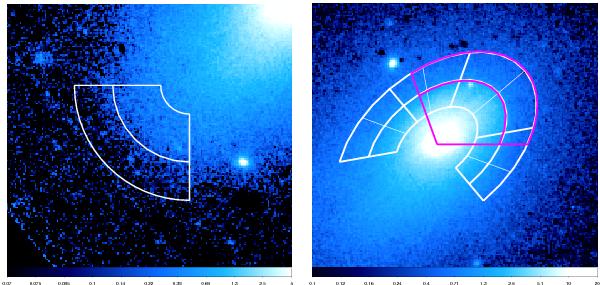
Zoom on the SE (left) and NW (right) cold fronts with the regions used for spectral and imaging analysis. The magenta region in the right panel has been used for deriving the global properties of the NW cold front (Sect. 3.2), the white region for the azimuthal extent surface brightness (thin lines) and temperature (thick lines) analysis (Sect. 3.2.1). The IN and OUT sector for the SE cold front are centered at (RA, Dec) = (15:58:40, +27:10:12.6); the elliptical sectors used for the NW cold front are centered at (RA, Dec) = (15:58:21, +27:13:41).
Current usage metrics show cumulative count of Article Views (full-text article views including HTML views, PDF and ePub downloads, according to the available data) and Abstracts Views on Vision4Press platform.
Data correspond to usage on the plateform after 2015. The current usage metrics is available 48-96 hours after online publication and is updated daily on week days.
Initial download of the metrics may take a while.