Fig. 2
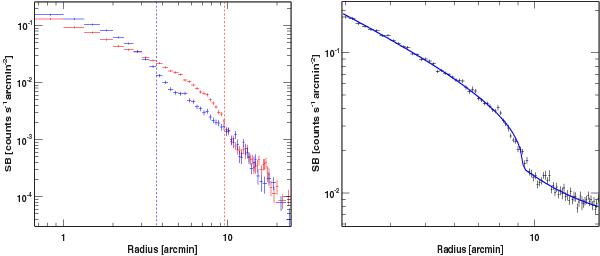
Left: ROSAT/PSPC background-subtracted surface-brightness profiles from the surface-brightness peak in the sectors with position angles 0–90° (blue) and 180–270° (red). The dashed lines show the position of the well-known NW cold front and of the newly-discovered SE discontinuity. Right: EPIC/pn surface-brightness profile across the SE discontinuity (position angles 180–250°) in the 0.5–2.0 keV band, fitted with a broken power law projected along the line of sight (blue curve) and smoothed to account for the XMM-Newton PSF.
Current usage metrics show cumulative count of Article Views (full-text article views including HTML views, PDF and ePub downloads, according to the available data) and Abstracts Views on Vision4Press platform.
Data correspond to usage on the plateform after 2015. The current usage metrics is available 48-96 hours after online publication and is updated daily on week days.
Initial download of the metrics may take a while.