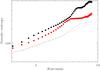
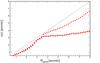
Fig. C.1
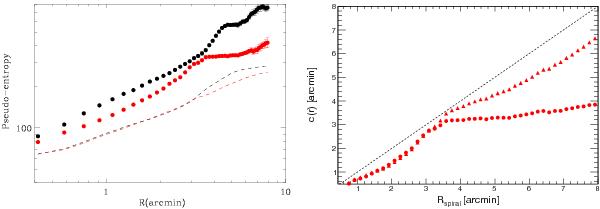
Left: pseudo-entropy profiles in the excess (red) and in the unperturbed region (black). Dashed lines show the entropy profiles in the elliptical simulation (rescaled for clarity) for the “excess” (red) and unperturbed (black) region. Right: corresponding radius c(r) for which the pseudo-entropy in the unperturbed region is equal to that in the spiral region. Circles are obtained by neglecting the ellipticity, while triangles are the values corrected assuming that the ellipticity is entirely intrinsic. The dashed line shows the one-to-one relation.
Current usage metrics show cumulative count of Article Views (full-text article views including HTML views, PDF and ePub downloads, according to the available data) and Abstracts Views on Vision4Press platform.
Data correspond to usage on the plateform after 2015. The current usage metrics is available 48-96 hours after online publication and is updated daily on week days.
Initial download of the metrics may take a while.