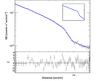
Fig. A.1
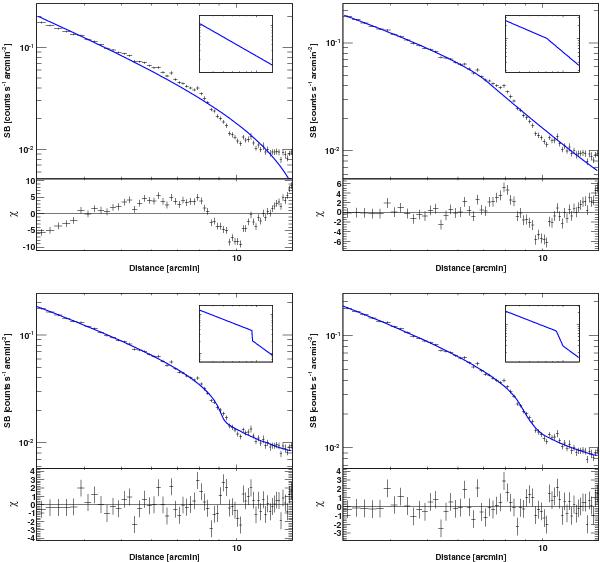
EPIC/pn surface brightness profile in the SE sector (position angles 180–250°) in the 0.5–2.0 keV band. The panel below each profile shows the residuals (Δχ2) of data from the best fit model. The insets show the density models used to fit the data: a single power-law (upper left panel), a double power-law (upper right panel), a broken power-law (lower left panel), and a triple power-law (lower right panel).
Current usage metrics show cumulative count of Article Views (full-text article views including HTML views, PDF and ePub downloads, according to the available data) and Abstracts Views on Vision4Press platform.
Data correspond to usage on the plateform after 2015. The current usage metrics is available 48-96 hours after online publication and is updated daily on week days.
Initial download of the metrics may take a while.