Fig. 9
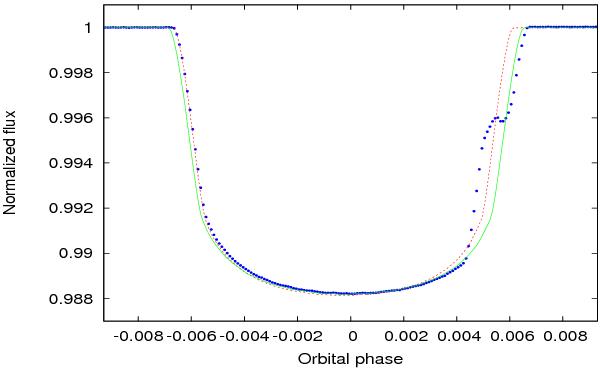
Transit light-curve of a star with a spot anomaly shown as a blue dot and a transiting planet with a radius of Rp/R∗ = 0.1. Overplotted is the best fit allowing transit duration, depth, and time to vary as free parameters (red dotted line), and the best fit obtained by holding the transit duration and depth constant and allowing only the transit timing to vary (green line).
Current usage metrics show cumulative count of Article Views (full-text article views including HTML views, PDF and ePub downloads, according to the available data) and Abstracts Views on Vision4Press platform.
Data correspond to usage on the plateform after 2015. The current usage metrics is available 48-96 hours after online publication and is updated daily on week days.
Initial download of the metrics may take a while.