Fig. 1
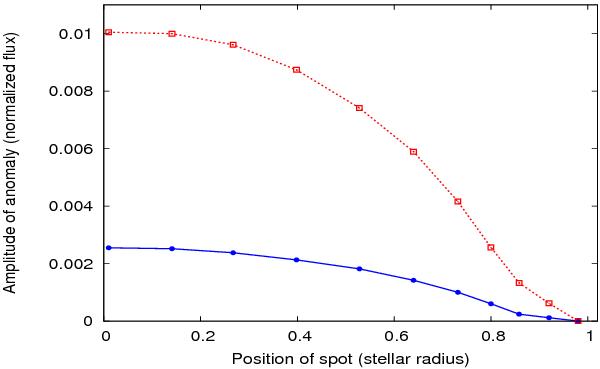
Amplitude of the anomaly in the transit light-curve as a function of the position of planet-spot overlap (0 on x-axis means overlap occurs while the spot is at the center of stellar disk). The values of the amplitude have been normalized to the flux value. The red dotted line and the blue solid line correspond to transit light-curves of a transiting planet with a radius of Rp/R∗ = 0.15 and a spot with a filling a factor of 1% and 0.25%, respectively.
Current usage metrics show cumulative count of Article Views (full-text article views including HTML views, PDF and ePub downloads, according to the available data) and Abstracts Views on Vision4Press platform.
Data correspond to usage on the plateform after 2015. The current usage metrics is available 48-96 hours after online publication and is updated daily on week days.
Initial download of the metrics may take a while.