Fig. 3
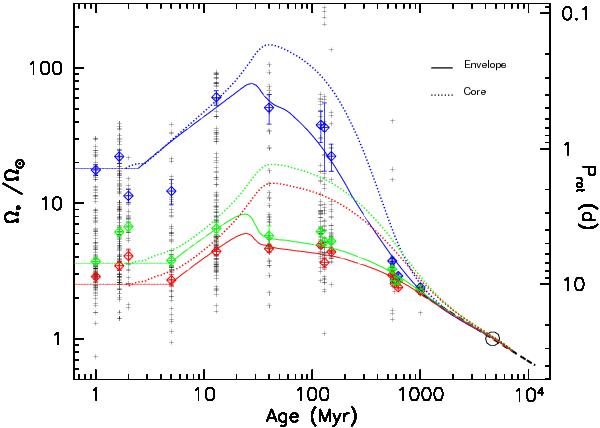
Angular velocity of the radiative core (dashed lines) and of the convective envelope (solid lines) as a function of time for fast (blue), median (green), and slow (red) rotator models. The angular velocity is scaled to the angular velocity of the present Sun. The blue, red, and green tilted squares and associated error bars represent the 90th percentile, the 25th percentile, and the median, respectively, of the rotational distributions of solar-type stars in star forming regions and young open clusters obtained with the rejection sampling method (see text). The open circle is the angular velocity of the present Sun and the dashed black line illustrates the Skumanich relationship, Ω ∝ t− 1/2.
Current usage metrics show cumulative count of Article Views (full-text article views including HTML views, PDF and ePub downloads, according to the available data) and Abstracts Views on Vision4Press platform.
Data correspond to usage on the plateform after 2015. The current usage metrics is available 48-96 hours after online publication and is updated daily on week days.
Initial download of the metrics may take a while.