Fig. 2
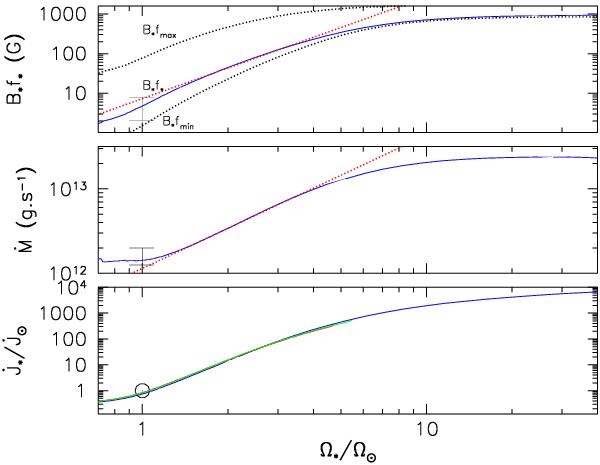
Upper panel: mean magnetic field strength
computed from the BOREAS subroutine as a function of stellar angular velocity
normalized to the Sun’s velocity. The Sun’s range of
B∗f∗ = 2 − 7.7 G
is shown as a vertical bar. The upper and lower dotted lines illustrate
B∗fmax and
B∗fmin, respectively.
The red dashed line is a power-law fit to
B∗f∗ in the
non-saturated regime (cf. Eq. (12)). Middle panel: the mass-loss rate computed from the
BOREAS subroutine as a function of stellar angular velocity normalized to the
Sun’s velocity. The range of Ṁ estimate for the Sun is shown with
a vertical bar. The red dashed line is a power-law fit to Ṁ in
the non-saturated regime (cf. Eq. (14)). Lower panel: the angular momentum loss rate as a
function of angular velocity. Both quantities are normalized to the Sun’s
( ,
and Ω⊙ = 2.87 × 10⁻⁶ s-1). Three overlapping
curves are illustrated for fast (blue), median (green), and slow (red) rotator
models. The temporal evolution of Teff and
R∗ is included in the computation of
,
and Ω⊙ = 2.87 × 10⁻⁶ s-1). Three overlapping
curves are illustrated for fast (blue), median (green), and slow (red) rotator
models. The temporal evolution of Teff and
R∗ is included in the computation of
 for each model.
Current usage metrics show cumulative count of Article Views (full-text article views including HTML views, PDF and ePub downloads, according to the available data) and Abstracts Views on Vision4Press platform.
Data correspond to usage on the plateform after 2015. The current usage metrics is available 48-96 hours after online publication and is updated daily on week days.
Initial download of the metrics may take a while.