Fig. 8
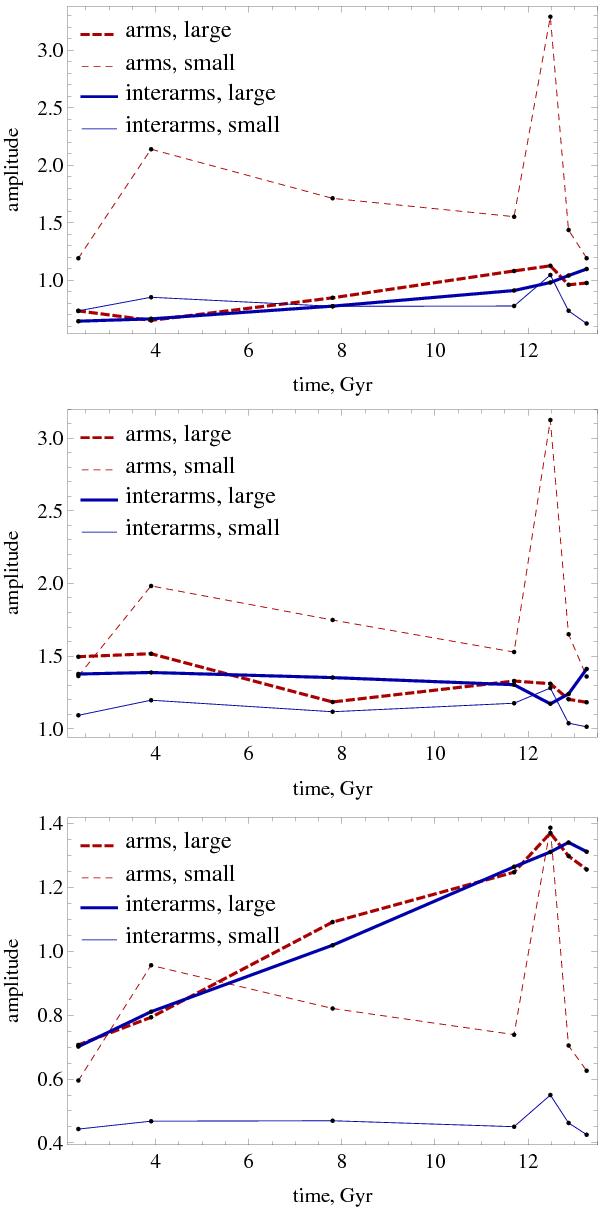
Quantification of arm/interarm contrast for large-scale (thick lines) and small-scale (thin lines) fields for material arms (red dashed lines) and interarm regions (blue solid lines), for models 75, 76, 77 (from top to bottom). The peak in small-scale field at approximate time 12 Gyr as well as other details of small-scale magnetic field distribution are probably caused by the chance coincidence of an injection event with the analysed snapshot of the field.
Current usage metrics show cumulative count of Article Views (full-text article views including HTML views, PDF and ePub downloads, according to the available data) and Abstracts Views on Vision4Press platform.
Data correspond to usage on the plateform after 2015. The current usage metrics is available 48-96 hours after online publication and is updated daily on week days.
Initial download of the metrics may take a while.