| Issue |
A&A
Volume 556, August 2013
|
|
|---|---|---|
| Article Number | A91 | |
| Number of page(s) | 6 | |
| Section | Extragalactic astronomy | |
| DOI | https://doi.org/10.1051/0004-6361/201321293 | |
| Published online | 02 August 2013 | |
X-ray observations of the Compton-thick Seyfert 2 galaxy, NGC 5643
1 Dipartimento di Matematica e Fisica, Università degli Studi Roma Tre, via della Vasca Navale 84, 00146 Roma, Italy
e-mail: matt@fis.uniroma3.it
2 European Space Astronomy Center of ESA, Apartado 50727, 28080 Madrid, Spain
3 ICREA and Institut de Ciéncies del Cosmos (ICC), Universitat de Barcelona (IEEC-UB), Marti i Franqués 1, 08028 Barcelona, Spain
4 Universidad Nacional Autonoma de Mexico, Apartado Postal 70-264 Ciudad Universitaria, D.F., CP 04510 México, Mexico
Received: 14 February 2013
Accepted: 10 June 2013
We present results from a ~55 ks long XMM-Newton observation of the obscured AGN, NGC 5643, performed in July 2009. A previous, shorter (about 10 ks) XMM-Newton observation in February 2003 had left two major issues open, the nature of the hard X-ray emission (Compton-thin vs. Compton-thick) and of the soft X-ray excess (photoionized vs. collisionally ionized matter). The new observation shows that the source is Compton-thick and that the dominant contribution to the soft X-ray emission is by photoionized matter (even if it is still unclear whether collisionally ionized matter may contribute as well). We also studied three bright X-ray sources that are in the field of NGC 5643. The ULX NGC 5643 X-1 was confirmed to be very luminous, even if more than a factor 2 fainter than in 2003. We then provided the first high-quality spectrum of the cluster of galaxies Abell 3602. The last source, CXOJ143244.5-442020, is likely an unobscured AGN, possibly belonging to Abell 3602.
Key words: galaxies: active / X-rays: galaxies / X-rays: individuals: NGC 5643 / X-rays: individuals: NGC 5643 X-1 / X-rays: individuals: Abell 3602 / X-rays: individuals: CXOJ143244.5-442020
© ESO, 2013
1. Introduction
NGC 5643 is a nearby (z = 0.004) SAB(rs)C galaxy, known to host a low-luminosity Seyfert 2 nucleus (Phillips et al. 1983). An extended emission-line region elongated in a direction close to the radio position angle (Morris et al. 1985), is probably the projection of a 1.8-kpc, one-sided ionization cone (Simpson et al. 1997). NGC 5643 belongs to the class of “extreme infrared” (IR) galaxies (Antonucci & Olszewski 1985). Although intense episodes of star formation are occurring in a nearly circular arm, mid-IR diagnostics suggest that the AGN dominates the IR energy budget (Genzel et al. 1998). Comparisons of optical spectra with synthesis models are, however, consistent with a “starburst/Seyfert 2 composite” spectrum (Cid Fernandes et al. 2001). The NGC 5643 nucleus is a strong radio emitter as well, most likely powered by the AGN (Kewley et al. 2000).
In X-rays, NGC 5643 has been observed by ASCA, BeppoSAX, Chandra and XMM-Newton. The Chandra image shows that the soft X-ray emission is spatially correlated with the HST [O iii] emission, like in many Seyfert 2s (Bianchi et al. 2006). The extended component accounts for about half of the total soft X-ray emission. The soft X-ray/[O iii] flux ratio is similar to that of the other sources of the Bianchi et al. (2006) sample, suggesting a common origin in a photoionized medium. On the other hand, the line diagnostics derived from the XMM-Newton RGS spectrum failed to reach a definitive answer on the dominant ionization process at work in the gas (Guainazzi & Bianchi 2007). The XMM-Newton hard X-ray spectrum is very flat, but whether this is due to Compton-thin absorption or to reflection from neutral matter (indicative of a Compton-thick source) cannot be said from that short (less than 10 ks) observation (Guainazzi et al. 2004).
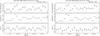 |
Fig. 1 0.3−10 keV (left panel) and 2−10 keV (right panel) light curves (pn only) for the 2009 observation. The source+background, the background alone, and the background-subtracted source count rates are shown in the upper, medium and lower panels, respectively. |
Interestingly, when the XMM-Newton spectrum is compared with previous BeppoSAX and ASCA observations, dramatic spectral variability is found. However, the point spread function (PSF) of the X-ray telescopes of these two satellites were not good enough to separate emission of the nucleus of NGC 5643 from that of a nearby (0.8′ away) X-ray source (christened NGC 5643 X–1 by Guainazzi et al. 2004) which, at the time of the XMM-Newton observation, was about as bright as the nucleus of NGC 5643 in the 2−10 keV band, and twice as bright in the 0.5−2 keV range. It is therefore impossible to ascribe the variability to either the NGC 5643 nucleus or X–1. It is worth noting that, if indeed belonging to NGC 5643, X–1 would be one of the brightest ULX known, being therefore interesting on its own.
In this paper we analyse a longer XMM-Newton observation, with the double aim of checking whether the soft X-ray emission is due to photoionized or collisionally ionized plasma and to determine whether the source is Compton-thin or Compton-thick. We also analyse NGC 5643 X–1 and the other bright sources present in the field.
The paper is organized as follows. In Sect. 2 the data reduction is described, while data analysis and results on NGC 5643 and on the brightest sources in the field (the ULX NGC 5643 X-1, the cluster of galaxies Abell 3602, the source CXOJ143244.5-442020 which is possibly an active galaxy belonging to Abell 3602) are reported in Sects. 3 and 4, respectively. The main results of the work are summarized in Sect. 5.
In the following, the standard cosmological model (H0 = 70 km s-1/Mpc, ΩM = 0.3 and Λ = 0.7) will be assumed.
2. Data reduction
NGC 5643 was observed by XMM-Newton twice, for ≃10 ks on 2003-02-08 (obsid 0140950101) and ≃55 ks on 2009-07-25 (obsid 0601420101). In both cases, the observations were performed with the EPIC CCD cameras, the pn and the two MOS, operated in full frame, and medium filter. Data were reduced with SAS 11.0.0 and screening for intervals of flaring particle background was done consistently with the choice of extraction radii, in an iterative process based on the procedure to maximize the signal-to-noise ratio (S/N) described by Piconcelli et al. (2004). After this process, the net exposure times were of about 7 (45), 9 (53), and 9 (51) ks for pn, MOS1 and MOS2, respectively, in obsid 0140950101 (0601420101), adopting extraction radii of 25 arcsec for all the cameras in the case of the nucleus of NGC 5643. Extraction radii for NGC 5643 X-1 are 26 arcsec for all the cameras, 21 arcsec for CXOJ143244.5-442020, and 90 arcsec for Abell 3602. The background spectra were extracted from source-free circular regions with a radius of 50 arcsec. Patterns 0 to 4 were used for the pn spectrum, while MOS spectra include patterns 0 to 12. Since the two MOS cameras were operated with the same mode, we co-added MOS1 and MOS2 spectra, after having verified that they agree with each other and with the summed spectrum. Finally, spectra were binned in order to oversample the instrumental resolution by at least a factor of 3 and to have no fewer than 30 counts in each background-subtracted spectral channel. The latter requirement allows us to use the χ2 statistics. Spectra were analysed with XSPECv12.6.0.
RGS spectra were extracted from event lists reduced through the SAS meta-task rgsproc. We used the optical coordinates of NGC 5643 from NED to fix the reference of the wavelength scale. In both XMM-Newton observations, NGC 5643 X-1 was placed along a direction perpendicular to the dispersion direction with respect to the AGN. This allowed us to minimize the contamination by NGC 5643 X-1 in the AGN spectrum by restricting the extraction region of the latter to 50% of the cross-dispersion PSF (the exact number was chosen to maximize the S/N of the AGN O vii emission line triplet). Likewise, NGC 5643 X-1 was not included in the background extraction region. We generated AGN+background and background spectra with 20 000 spectral channels to optimally exploit the RGS resolving power. Spectra were analysed with XSPECv12.6.0 in the 0.2−2 keV energy range, using the Cash goodness-of-fit test on the unbinned spectrum. Details on the spectral analysis procedures can be found in Guainazzi & Bianchi (2007).
3. Data analysis and results on NGC 5643
 |
Fig. 2 Left panel: spectrum and best fit model and residuals for the 2009 observation, when fitting with a two power law model (pn only). Right panel: the same with the reflection model (see text), and a narrow iron Kα line. |
3.1. The 2009 observation. Phenomenological model
In Fig. 1 the 0.3−10 keV (left panel) and 2−10 keV (right panel) light curves of the pn are shown. The source+background, the background alone, and the background-subtracted source count rates are shown in the upper, medium, and lower panels, respectively. No statistically significant variations are apparent, and therefore we used the time-integrated spectrum for the spectral analysis.
In Fig. 2 (left panel) a fit to the 0.3−10 keV pn spectrum with a model composed of two power laws (plus Galactic absorption, NH,Gal = 8.01 × 1020 cm-2, Kalberla et al. 2005) is presented for illustration purposes. The fit is clearly bad, with several features in the 0.5− keV band and a very prominent iron Kα fluorescent line. The two power-law photon indices are about 3 (the soft one) and − 0.87 (the hard one). The inverted hard power law suggests either significant absorption or a reflection-dominated spectrum.
We therefore added several narrow (i.e. unresolved) emission lines (see Table 1) and substituted the hard power law with a pure, neutral reflection component (see Sect. 3.2 for a discussion of the soft X-ray emission). The soft power law and emission lines indicate reflection from warm matter, and the neutral reflection and the iron Kα line from cold matter. The fit is decent (χ2/d.o.f. = 111.9/91) even if the power law illuminating the cold reflecting matter is still unusually flat (1.11 ± 0.21). Inspection of the residuals (see Fig. 2, right panel) shows that most of the remaining problems reside around the iron line. Indeed, an improvement is found (χ2/d.o.f. = 106.7/90) by leaving the width of the line free to vary ( eV). A comparable fit (χ2/d.o.f. = 107.1/90) is found keeping the line narrow and adding a Compton shoulder (CS, modelled as a Gaussian with centroid energy of 6.3 keV and σ = 40 eV, see e.g. Molendi et al. 2003). A further improvement (χ2/d.o.f. = 99.1/88) is found by adding the Ni Kα emission line.
Centroid energies, fluxes and equivalent widths (EW) of the emission lines.
The CS-to-core ratio is consistent with what is expected in Compton-thick matter (Matt 2002). The iron Kβ/Kα and the Ni/Fe line ratios are also consistent (within the quite large errors) with expectations (Molendi et al. 2003), while the power law indices for the best fit model are ΓS = 3.12 ± 0.10 and  . The hard power law is still rather flat. However, it must be recalled that it is not determined directly. In fact, it is the illuminating source of the cold reflection component (the only visible one) and, moreover, is estimated in a limited energy band (the bulk of the reflection component is emitted above 10 keV). The equivalent width (EW) of the iron Kα line is more than 1 keV, a value expected in a pure reflection spectrum.
As a sanity check, we imposed the best fit model described above to the MOS1+2 spectrum, without any fitting. A value of χ2/bins = 99.1/118 is obtained, demonstrating that the MOS and pn spectra are in very good agreement.
The observed 2−10 keV flux is 7.66(± 0.19) × 10-13 erg cm-2 s-1, corresponding to a luminosity of 2.7 × 1040 erg s-1.
Further tests were then applied to the pn spectrum. The addition of a partial Compton-thin absorber in front of the Compton reflection component does not improve the quality of the fit. Pure absorption instead of reflection is also not a viable option. The fit is decent (χ2/d.o.f. = 109.2/89), but the power law index is very flat ( , with
 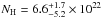 cm-2: if the power law index is forced to the more reasonable value of 1.5, the fit is definitely worse, χ2/d.o.f. = 129.1/90), unless the absorption is partial (χ2/d.o.f. = 111.0/89, covering fraction of 0.925
 ). Moreover, the very large iron line EW (about 1.5 keV with respect to the unabsorbed primary continuum) is unexplained.
Therefore, from the analysis of the broad band X-ray spectrum of NGC 5643 we can conclude that the spectrum is entirely due to reflection from warm and cold matter, the typical spectrum of a Compton-thick source. This conclusion is strengthened by the 2−10 keV/[O iii] flux ratio. The de-reddened [O iii] flux is about 7 × 10-12 erg cm-2 s-1 (Bassani et al. 1999), and the flux ratio is therefore well within the Compton-thick regime (Bassani et al. 1999; Lamastra et al. 2009; Marinucci et al. 2012).
3.2. The 2009 observation. The soft X-ray emission
The presence of lines with such different ionization potentials, along with the presence of radiative recombination continua (RRC), argue in favour of photoionized emitting matter. In fact, substituting in the pn spectrum the soft power law and the emission lines (apart from the iron and nickel lines from neutral matter) with a thermal plasma component (mekal model in xspec), an unacceptable fit (χ2/d.o.f. = 239.6/109) is obtained. By adding a second thermal component the fit is still significantly worse than with a power law plus emission lines (χ2/d.o.f. = 152.9/106), and with metal abundances very low, less than 10% the solar value. Not even the addition of a third thermal component suffices to obtain a good fit (χ2/d.o.f. = 142.1/103).
To check whether the soft X-ray emission is indeed due to photoionized matter, we substituted the phenomenological model (i.e., a power law plus as many emission lines as required by the data) by a physical model based on cloudy (last described in Ferland et al. 1998). Details on the model can be found in Bianchi et al. (2010); here, we just recall that it is a tabular model, with the tables built assuming solar abundances, an illuminating continuum as described in Korista et al. (1997) and an electron density of 103 cm-3. The model is rather insensitive to the latter parameter over a wide range of values.
Parameters of the best fit models of the soft X-ray emission.
A single photoionized region is clearly insufficient (χ2/d.o.f. = 256.2/107), and the addition of a second (χ2/d.o.f. = 210.7/104) and even of a third (χ2/d.o.f. = 161.6/101) and a fourth (χ2/d.o.f. = 143.2/98) region, while improving the quality of the fit, is not sufficient to provide an acceptable fit. This contrasts with other sources where spectra of comparable signal-to-noise are well fitted by a small number of photoionized regions (e.g. Bianchi et al. 2010; Marinucci et al. 2011).
The bad fit is largely due to residuals around 0.75 keV and 1.8 keV, possibly related to enhanced O vii RRC and/or Fe xvii 3F line, and Si xiii Kα line, respectively. Indeed, adding two emission lines in addition to three photoionized regions results in a much better, and now acceptable, fit (χ2/d.o.f. = 107.4/97). This may correct for some rigidities in the adopted model, such as the use of solar abundances and the assumption of well separated emitting regions. The parameters for this fit are summarized in Table 2 (Model A). No further improvement is found with a fourth photoionized region. One emitting region is thick and not very ionized, while the other two are much thinner and have moderate and high ionization, respectively.
Alternatively, the inability of a pure photoionization model to reproduce the data well may be due to the presence also of collisionally ionized plasma. This hypothesis is corroborated by the best-fit energies of the O vii and Ne ix triplets, which suggest a non-neglibile contribution by the resonant lines. A decent fit is, however, obtained only with no less than two photoionized and one collisionally ionized regions (χ2/d.o.f. = 134.5/101). A better fit is obtained adding either a further collisionally ionized region (χ2/d.o.f. = 118.2/98) or a third photoionized region (χ2/d.o.f. = 117.2/98). Adding a second collisionally ionized region to the latter fit does not lead to any improvement. Because a feature in the residuals is still apparent around 1.8 keV, an emission line was added, resulting in χ2/d.o.f. = 108.1/97. The parameters for the latter fit are summarized in Table 2 (Model B).
With respect to model A, the high ionization photoionized emitting region is almost unchanged. The low ionization region is now thin, while the moderate ionization is thick. The metal abundance in the collisionally ionized component, A, is very poorly constrained, so it has been fixed to 1. The emission measure is 8.6 × 1061 cm-3. In order for the emitting region to be optically thin to Compton scattering, its radius must be larger than about 1013 cm, a value that does not give any valuable information on the nature of this region.
It must be pointed out that in both model A and B the index of the hard power law is rather flat, less than about 1.5 at 90% confidence level. As remarked above, this parameter is determined indirectly from the reflection component, which dominates only above 3 keV, where the quality of the spectrum is modest (see Fig. 2).
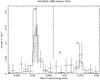 |
Fig. 3 RGS spectrum and model of the o vii complex. |
We also analysed the RGS data to try to separate the line multiplets into their components and exploit their diagnostic power. Three emission lines have been detected: the O vii Kα forbidden and resonant lines at 0.5610 ± 0.0004 keV and 0.575 keV, respectively, and the O viii Kα doublet (unresolved) at 0.6531 ± 0.0006 keV. Fluxes are 11
 ph cm-2 s-1, 3.1
 ph cm-2 s-1, and 5.9
 ph cm-2 s-1, respectively (see Fig. 3 for the O vii complex). Both the O vii forbidden/resonant ratio (Porquet & Dubau 2000) and the O vii/ O viii ratio (Guainazzi & Bianchi 2007) suggest that the dominant process is photoionization, confirming the results from the broad band analysis even if, as discussed above, a further contribution by collisionally ionized plasma cannot be ruled out.
From the best fit parameters it is not easy to derive the location of the ionized reflecting regions, because we do not know the density of the matter (the fit is largely insensitive to this parameter) and the intrinsic luminosity of the source. Assuming a density of 103 cm-3 (appropriate for the NLR), a factor 70 between instrinsic and reflected luminosities (as appropriate for a Compton-thick source, Marinucci et al. 2012), and an average power law index of 1.7 to extrapolate the 2−10 keV luminosity down to 1 Rydberg, we obtain for the three reflecting zones (model B) an inner radius of about 2, 1, and 0.15 parsecs, respectively. The outer radius depends on the radial dependence of the density, and can be derived from the best fit values for the column density. Assuming that the higher column-density, brighter reflector is the one responsible for the extended emission observed by Chandra up to 500−600 pc (Bianchi et al. 2006), a r-1 dependence of the density is found, while the other two reflectors are too small to be resolved even by Chandra, and even assuming a r-2 radial dependence.
3.3. The 2003 observation
We then imposed the best-fit phenomenological model described above to the spectra (both pn and MOS1+2) of the 2003 observation without any fitting or renormalization procedure. The result is shown in Fig. 4. By leaving the reflection component and the iron line parameters free to vary, parameters values consistent with those found in the 2009 observation are obtained. We therefore conclude that there is no significant variation between the two observations.
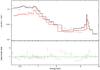 |
Fig. 4 The 2003 spectrum with superimposed the best fit model for the 2009 spectrum. Both pn (black) and MOS1+2 (red) spectra are shown. |
4. Other sources in the field
There are other bright sources in the field of NGC 5643 (see Fig. 5), the most prominent one being NGC 5643 X-1, which is very close to the active nucleus and one of the brightest ULX known (Guainazzi et al. 2004). There is also an extended source, to be associated with the cluster of galaxies Abell 3602, and a point-like source, possibly a galaxy belonging to Abell 3602, and identified with the CXOJ143244.5-442020 Chandra source. The coordinates of all these sources are listed in Table 3.
In all fits described below, the same Galactic absorption as for NGC 5643 is assumed.
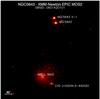 |
Fig. 5 The MOS2 field of view. |
Coordinates of the brighest sources in the field of view.
4.1. NGC 5643 X-1
Following Guainazzi et al. (2004), we fitted the pn and MOS1+2 spectra with a model consisting of a power law absorbed by both Galactic and local materials. The intrinsic absorber is much smaller (NH < 3 × 1020 cm-2) than in 2003, suggesting a variation in the local environment. In the subsequent fits, only Galactic absorption was included. The spectra are rather noisy, also because the source is partly in a gap in the pn, with a significant reduction in detected counts. The fit is not very good (χ2/d.o.f. = 166.1/133), but no clear features are present in the residuals (see Fig. 6). The power law index is 1.65 ± 0.04, which is consistent with the 2003 value. The 2−10 keV flux is 3.52(± 0.10) × 10-13 erg cm-2 s-1, more than a factor of two lower than in the previous observation, thus indicating a change in the luminosity but not in the intrinsic shape of the emission. The corresponding luminosity is 1.2 × 1040 erg s-1, if the source belongs to NGC 5643.
Adding a multicolour black body disk component (diskbb in xspec), as is customary for this class of sources, a slightly better fit is found (χ2/d.o.f. = 156.0/131, improvement significant at the 98.4% confidence level according to the F-test). The power law index is now 1.42 ± 0.13 and the inner disk temperature is 0.37 ± 0.06 keV. The inner radius is about 790/ km (θ being the disk inclination angle). Assuming that the inner radius coincides with the ISCO for a Schwarzschild black hole, a black hole mass of about 90/ solar masses would be derived. Even higher masses would be, of course, derived for a spinning black hole.
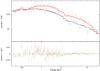 |
Fig. 6 EPIC Spectra and best fit model and residuals for NGC 5643 X-1 (black: pn, red: MOS). |
4.2. Abell 3602
This source is clearly extended (see Fig. 5), and should be identified with the cluster of galaxies Abell 3602, even if the NED coordinates (taken from Abell et al. 1989) are slightly different than ours and seem to refer instead to CXOJ143244.5-442020 (see next paragraph).
Abell 3602 was observed by the Einstein observatory and has an entry in the ROSAT Bright Source catalogue. No hard X-ray data have been published yet to our knowledge. Its optical extension is about 150′′ × 150′′ (Abell et al. 1989). The redshift is estimated to be 0.1044 (White et al. 1997, adopting the tenth brightest galaxy distance estimator) or 0.1047 (photometric redshift, Coziol et al. 2009).
The spectra were extracted in a region of 90” in radius to exclude the point-like source CXOJ143244.5-442020 (see Fig. 5). At the redshift of the cluster this angular radius corresponds to 173 kpc. The spectra of 2003 and 2009 are perfectly consistent with each other. For the spectral fitting we only used the 2009 data, because the addition of the 2003 spectrum does not increase the S/N significantly. The pn spectrum is well fitted (χ2/d.o.f. = 138.2/140, see Fig. 7) by an optically thin thermal plasma (mekal model in xspec) with a temperature of 4.37 keV1, a metal abundance (with respect to solar) of 0.49
 , and a redshift of 0.120 ± 0.008 (not too different from the optical values). The 2−10 keV flux is 1.52(± 0.05) × 10-12 erg cm-2 s-1, and the resulting 2−10 keV luminosity is 4.4 × 1043 erg s-1, using the optical redshift.
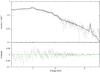 |
Fig. 7 pn spectrum and best fit model and residuals for Abell 3602. |
4.3. CXOJ143244.5-442020
Not very distant from the centre of Abell 3602 (137′′, corresponding to about 260 kpc at the cluster’s optical redshift), there is another bright X-ray source, CXOJ143244.5-442020. The 2009 spectrum of the source is well fitted (χ2/d.o.f. = 60.8/58) by a single power law with Γ = 2.02 ± 0.07. The 2−10 keV flux is 1.90(± 0.23) × 10-13 erg cm-2 s-1. If the source belongs to Abell 3602, this corresponds to a 2−10 keV luminosity of 5.3 × 1042 erg s-1.
When adding a narrow neutral iron Kα line at 6.4 keV and leaving the source redshift free to vary, only a slight improvement in the fit is found (χ2/d.o.f. = 56.3/56, significant at the 88% confidence level according to the F-test). Interestingly, the redshift is constrained to be in the range [0.08, 0.17] which, albeit with a large error, is consistent with that of Abell 3602 (see previous paragraph). Fixing its value to that of the cluster, the iron line equivalent width is 0.35 ± 0.29 keV.
The 2003 spectrum is very poor. Not surprisingly, a power law fit provides again a good fit (χ2/d.o.f. = 7.7/13), with Γ = 2.22 ± 0.15. The 2−10 keV flux is 2.10(± 0.5) × 10-13 erg cm-2 s-1.
The most likely hypothesis is that this source is an unobscured AGN, possibly belonging to Abell 3602.
5. Summary
The relatively long XMM-Newton observation of NGC 5643 performed in 2009 has solved the two main issues left open by the previous, shorter observation, performed in 2003. In fact, it has been possible to show that the source is Compton-thick. Regarding the nature of the soft X-ray emission, the dominant contribution is by photoionized matter, even if it is still unclear whether collisionally ionized matter contributes as well.
The ULX NGC 5643 X-1 was confirmed to be very luminous, even if more than a factor 2 fainter than in 2003.
Two other bright sources are also present in the field of NGC 5643. The cluster of galaxies Abell 3602 is one of them, and we are able to provide the first good quality spectrum above 2 keV. The second source, CXOJ143244.5-442020, is likely an unobscured AGN belonging to Abell 3602.
A mass M500 ~ 3.2 × 10¹⁴M⊙ can be derived from the M-T relationship of Arnaud et al. (2005).
Acknowledgments
We thank the referee, Marco Salvati, for useful comments which helped to improve the clarity of the paper, and Stefano Ettori for useful discussions on Abell 3602. Based on observations obtained with XMM-Newton, an ESA science mission with instruments and contributions directly funded by ESA Member States and the USA (NASA). G.M. and S.B. acknowledge financial support from ASI under grant I/009/10/0.
References
- Abell, G. O., Corwin, H. G., & Olowin, R. P. 1989, ApJS, 70, 1 [NASA ADS] [CrossRef] [EDP Sciences] [Google Scholar]
- Antonucci, R. R. J., & Olszewski, E. W. 1985, AJ, 90, 2003 [Google Scholar]
- Arnaud, M., Pointecouteau, E., & Pratt, G. W. 2005, A&A, 441, 893 [NASA ADS] [CrossRef] [EDP Sciences] [Google Scholar]
- Bassani, L., Dadina, M., Maiolino, R., et al. 1999, ApJS, 121, 473 [NASA ADS] [CrossRef] [Google Scholar]
- Bianchi, S., Guainazzi, M., & Chiaberge, M. 2006, A&A, 448, 499 [NASA ADS] [CrossRef] [EDP Sciences] [Google Scholar]
- Bianchi, S., Chiaberge, M., Evans, D. A., et al. 2010, MNRAS, 405, 553 [NASA ADS] [Google Scholar]
- Cid Fernandes, R., Heckman, T., Schmitt, H., et al. 2001, ApJ, 558, 81 [NASA ADS] [CrossRef] [Google Scholar]
- Coziol, R., Andernach, H., Caretta, C. A., et al. 2009, AJ, 137, 4795 [NASA ADS] [CrossRef] [Google Scholar]
- Ferland, G. J., Korista, K. T., Verner, D. A., et al. 1998, PASP, 110, 761 [Google Scholar]
- Genzel, R., Lutz, D., Sturm, E., et al. 1998, ApJ, 498, 579 [NASA ADS] [CrossRef] [Google Scholar]
- Guainazzi, M., & Bianchi, S. 2007, MNRAS, 374, 1290 [NASA ADS] [CrossRef] [Google Scholar]
- Guainazzi, M., Rodriguez-Pascual, P., Fabian, A. C., et al. 2004, MNRAS, 355, 297 [NASA ADS] [CrossRef] [Google Scholar]
- Kalberla, P. M., Burton, W. B., Hartmann, Dap, et al. 2005, A&A, 440, 775 [NASA ADS] [CrossRef] [EDP Sciences] [Google Scholar]
- Kewley, L. J., Heisler, C. A., Dopita, M. A., et al. 2000, ApJ, 530, 704 [NASA ADS] [CrossRef] [Google Scholar]
- Korista, K., Baldwin, J., Ferland, G., et al. 1997, ApJS, 108, 401 [NASA ADS] [CrossRef] [Google Scholar]
- Lamastra, A. 2009, A&A, 504, 73 [NASA ADS] [CrossRef] [EDP Sciences] [Google Scholar]
- Marinucci, A., Bianchi, S., Matt, G., et al. 2011, A&A, 526, A36 [NASA ADS] [CrossRef] [EDP Sciences] [Google Scholar]
- Marinucci, A., Bianchi, S., Nicastro, F., et al. 2012, ApJ, 748, 130 [NASA ADS] [CrossRef] [Google Scholar]
- Matt, G. 2002, MNRAS, 337, 147 [NASA ADS] [CrossRef] [Google Scholar]
- Molendi, S., Bianchi, S., & Matt, G. 2003, MNRAS, 343, L1 [NASA ADS] [CrossRef] [Google Scholar]
- Morris, S., Ward, M., Whittle, M., et al. 1985, MNRAS, 216, 193 [NASA ADS] [CrossRef] [Google Scholar]
- Phillips, M. M., Charles, P. A., & Baldwin, J. A. 1983, ApJ, 266, 485 [NASA ADS] [CrossRef] [Google Scholar]
- Porquet, D., & Dubau, J. 2000, A&AS, 143, 495 [NASA ADS] [CrossRef] [EDP Sciences] [Google Scholar]
- Simpson, C., Wilson, A. S., Bower, G., et al. 1997, ApJ, 474, 121 [NASA ADS] [CrossRef] [Google Scholar]
- White, D. A., Jones, C., & Forman, W. 1997, MNRAS, 292, 419 [NASA ADS] [CrossRef] [Google Scholar]
All Tables
All Figures
|
Fig. 1 0.3−10 keV (left panel) and 2−10 keV (right panel) light curves (pn only) for the 2009 observation. The source+background, the background alone, and the background-subtracted source count rates are shown in the upper, medium and lower panels, respectively. |
| In the text | |
|
Fig. 2 Left panel: spectrum and best fit model and residuals for the 2009 observation, when fitting with a two power law model (pn only). Right panel: the same with the reflection model (see text), and a narrow iron Kα line. |
| In the text | |
|
Fig. 3 RGS spectrum and model of the o vii complex. |
| In the text | |
|
Fig. 4 The 2003 spectrum with superimposed the best fit model for the 2009 spectrum. Both pn (black) and MOS1+2 (red) spectra are shown. |
| In the text | |
|
Fig. 5 The MOS2 field of view. |
| In the text | |
|
Fig. 6 EPIC Spectra and best fit model and residuals for NGC 5643 X-1 (black: pn, red: MOS). |
| In the text | |
|
Fig. 7 pn spectrum and best fit model and residuals for Abell 3602. |
| In the text | |
Current usage metrics show cumulative count of Article Views (full-text article views including HTML views, PDF and ePub downloads, according to the available data) and Abstracts Views on Vision4Press platform.
Data correspond to usage on the plateform after 2015. The current usage metrics is available 48-96 hours after online publication and is updated daily on week days.
Initial download of the metrics may take a while.