Fig. 5
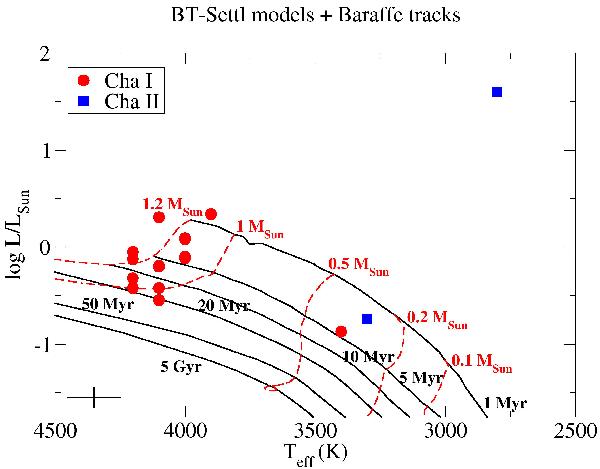
Hertzprung-Russell diagram for our candidate members of Cha I and II with good fits, compared to the isochrones and mass tracks from Baraffe et al. (1998) (solid black lines and dashed red lines, respectively). The plotted isochrones correspond to ages of 1, 5, 10, 20, 50 Myr and 5 Gyr (from top to bottom), and the mass tracks to 1.2, 1, 0.5, 0.2, and 0.1 M⊙ (from left to right). The cross in the bottom-left corner of the diagram indicates the typical error.
Current usage metrics show cumulative count of Article Views (full-text article views including HTML views, PDF and ePub downloads, according to the available data) and Abstracts Views on Vision4Press platform.
Data correspond to usage on the plateform after 2015. The current usage metrics is available 48-96 hours after online publication and is updated daily on week days.
Initial download of the metrics may take a while.