Fig. 2
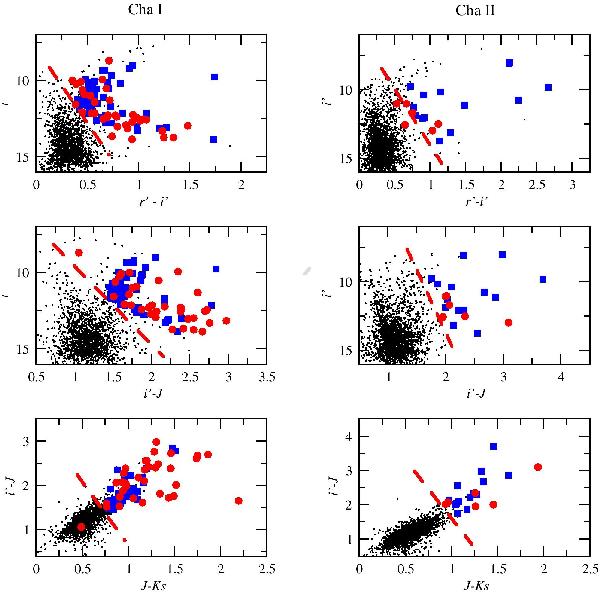
Colour–colour and colour–magnitude diagrams used to select new candidate members of Cha I and II (blue squares) from the list of objects with compatible proper motions seen towards the same area of the sky (black dots). Only those objects that are located in all diagrams in the same area as most of the confirmed members (red circles) are selected. To help the eye, the thick dashed red lines indicate the approximate selection areas. See Sect. 2.1 for details.
Current usage metrics show cumulative count of Article Views (full-text article views including HTML views, PDF and ePub downloads, according to the available data) and Abstracts Views on Vision4Press platform.
Data correspond to usage on the plateform after 2015. The current usage metrics is available 48-96 hours after online publication and is updated daily on week days.
Initial download of the metrics may take a while.